glucose-grand-prix
Glucose Grand Prix
Visualise your daily blood sugar as a Formula 1 race.
Author: Richard Hall
LinkedIn
EarthTunnelling.com
📖 Introduction
Glucose Grand Prix is a quirky project I put together after finding a neat way to extract my blood sugar data from Glooko. I wanted to create my own charts, but the data downloads only allowed 90 days at a time and came as multiple CSV files bundled in a ZIP. It was not exactly user-friendly.
With a bit of hacking around, I discovered how to use their session-authenticated browser APIs. That meant I could now grab all my data (or just a few hours’ worth) in JSON format using Chrome’s DevTools. Perfect.
At first, I thought it would be a great trick to share with other Glooko users. Then I remembered not everyone is quite as obsessed with data as I am. That thought completely sidetracked me. I started wondering what someone else might actually do with this data.
I’d recently seen stories about a diabetic Barbie and a diabetic Marvel superhero. Both were created for kids, which is a lovely idea. But not all kids relate to dolls or superheroes. There are loads of kids (and adults) who are really into F1.
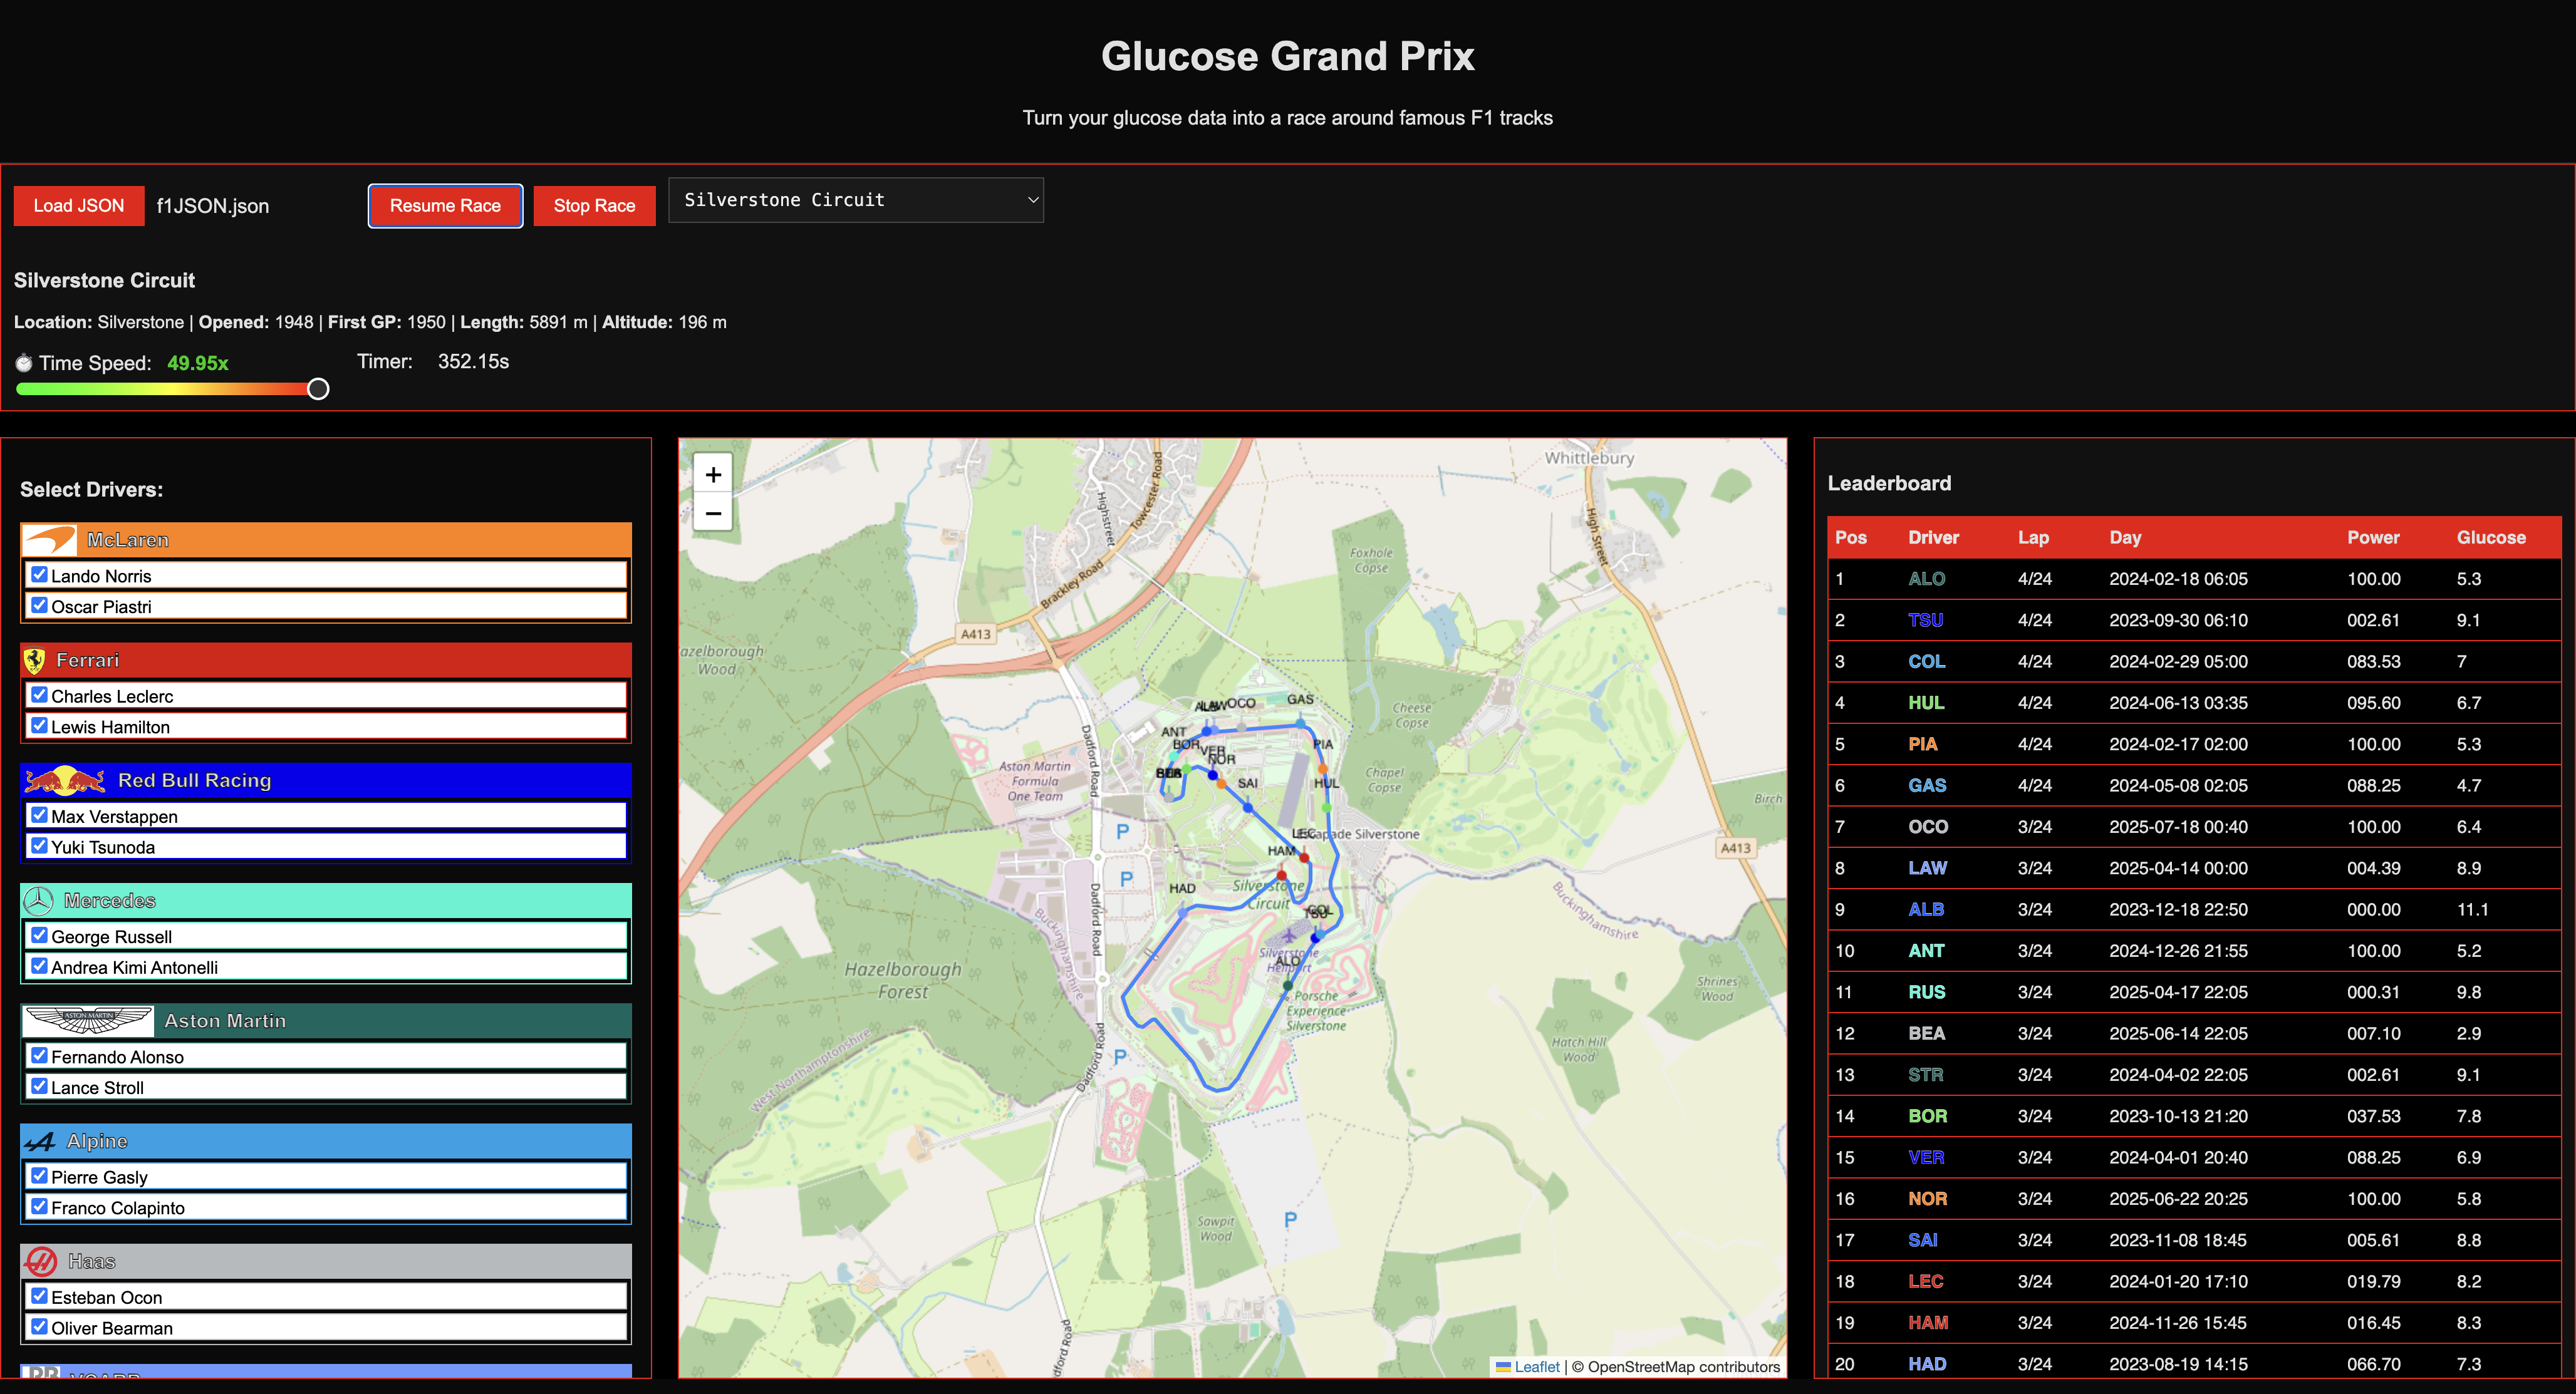
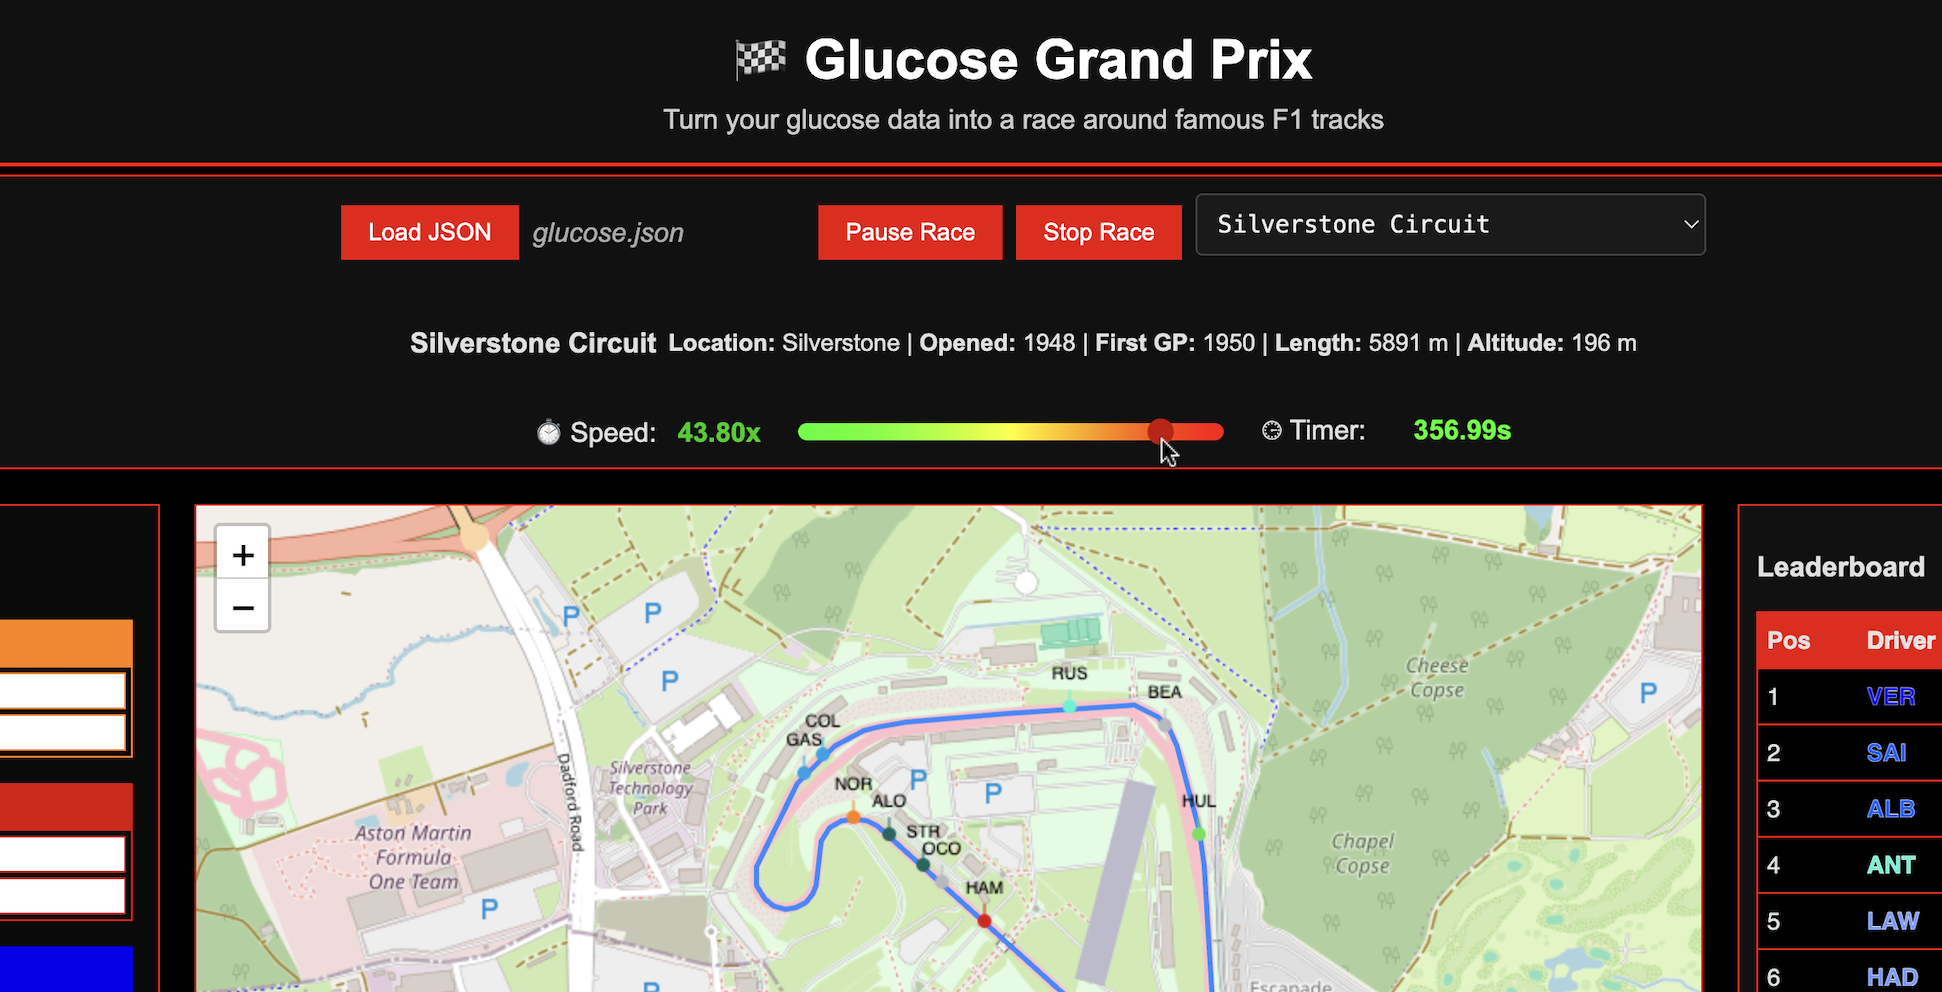
That’s when it hit me. What if I could use glucose data to “fuel” Formula 1 cars? Just like that, the idea of Glucose Grand Prix was born. A webpage that turns your blood sugar readings into something a bit different. A race car tearing around a virtual F1 track.
Each day’s data becomes a lap. Each data point becomes a step forward. Your glucose control becomes the determining factor in how smoothly your car makes it around the track. The better your day, the faster and cleaner the lap.
This project is a proof of concept. It’ll be open to anyone who wants to try it or enhance it.
🛠️ What this project does
This is a browser-based web app (no install needed!) that:
- Loads your blood glucose data from a JSON file
- Animates multiple days as racing laps around a real F1 circuit
- Maps glucose control to car speed, using Gaussian scoring
- Shows leaderboard-style stats like time-in-range, high/low/mid, and deviation
- Lets you choose which F1 drivers to include
- Includes multiple tracks with real F1 circuit data
- The result of the race reveals your best days with regard to control
- You can download the details of your best days
What it doesn’t do:
- Upload your data anywhere (everything runs in the browser)
- Require any medical device integration (you load your JSON manually)
📤 How to Extract Your Glooko Data via Chrome DevTools
This guide shows how to extract your own Glooko data using the browser’s built-in developer tools.
No scripts. No extensions. Just you, Chrome, and a little patience. Once you have followed this step, you can use the data you have collected to run the Glucose Grand Prix.
⚠️ Note: This method uses the same session your browser is already logged into.
It is secure and personal. The data is never shared unless you choose to download or use it elsewhere.
🧭 Step-by-Step Instructions
-
Open Glooko and log in as usual. You should land on the Summary page.
-
Click on the Graphs tab to load your glucose history.
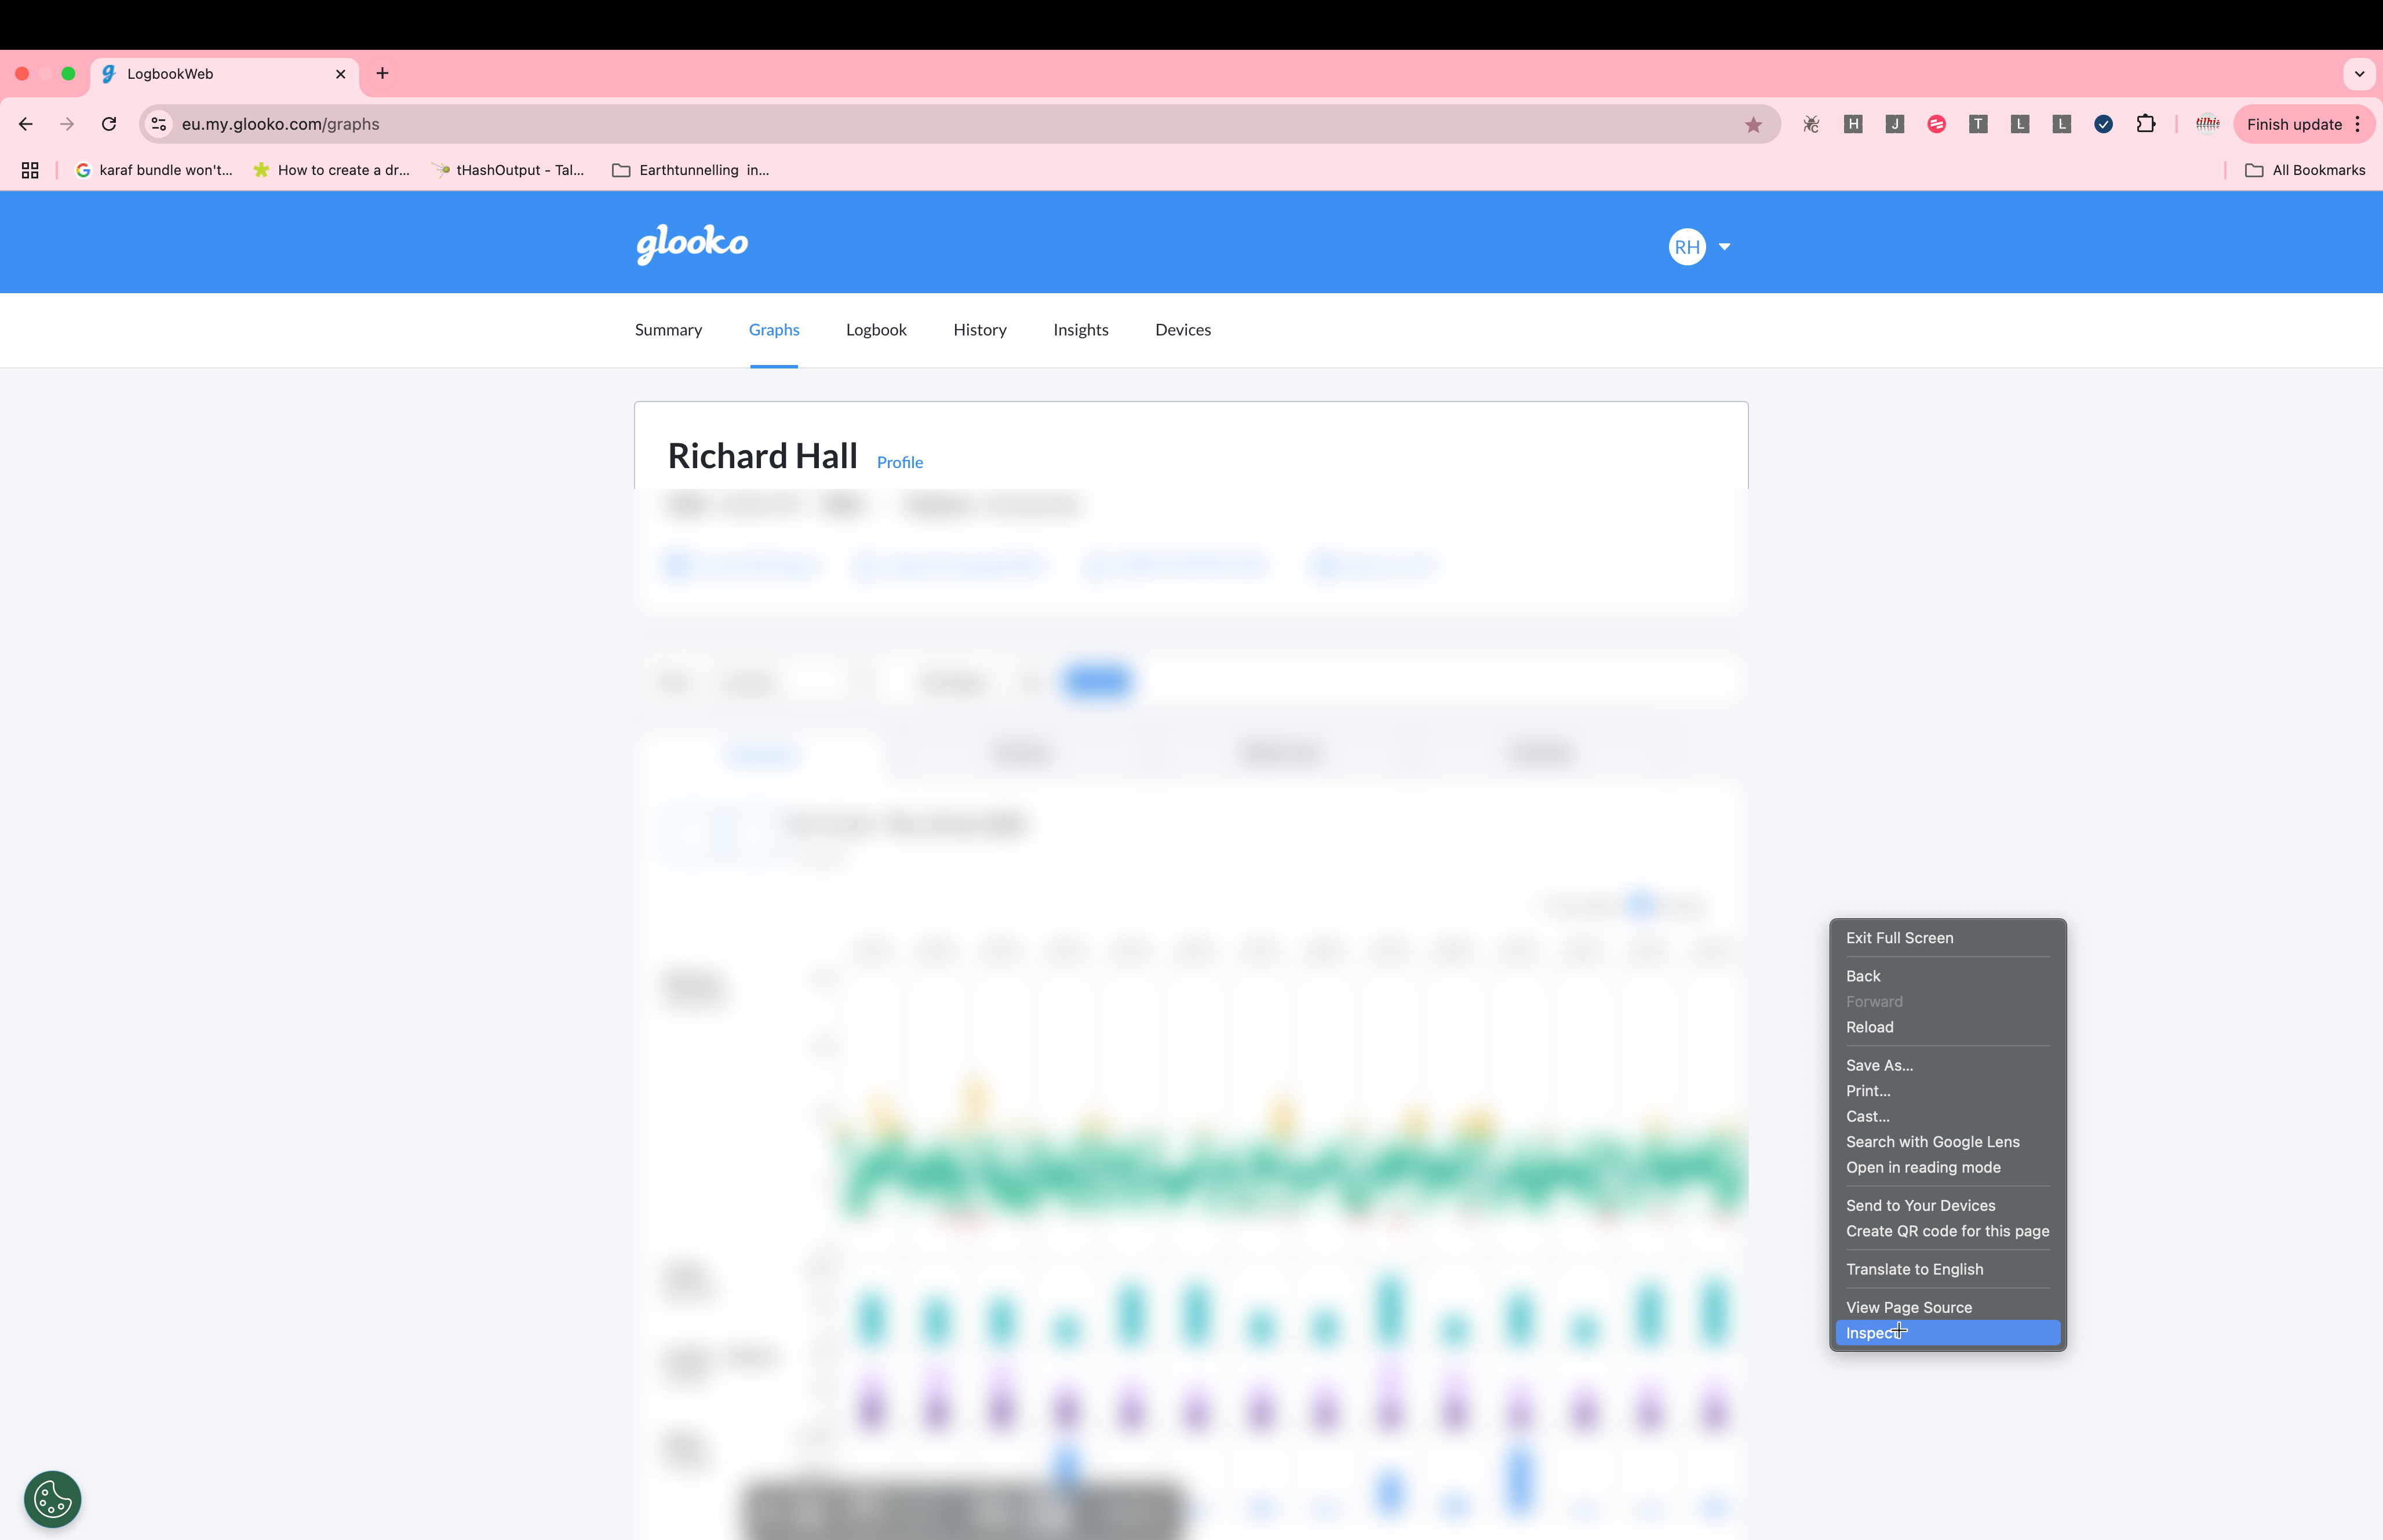
- Open DevTools:
- Right-click anywhere on the page and select Inspect,
- or press
Cmd + Option + I(Mac) /Ctrl + Shift + I(Windows).
-
In the DevTools panel, click the Network tab.
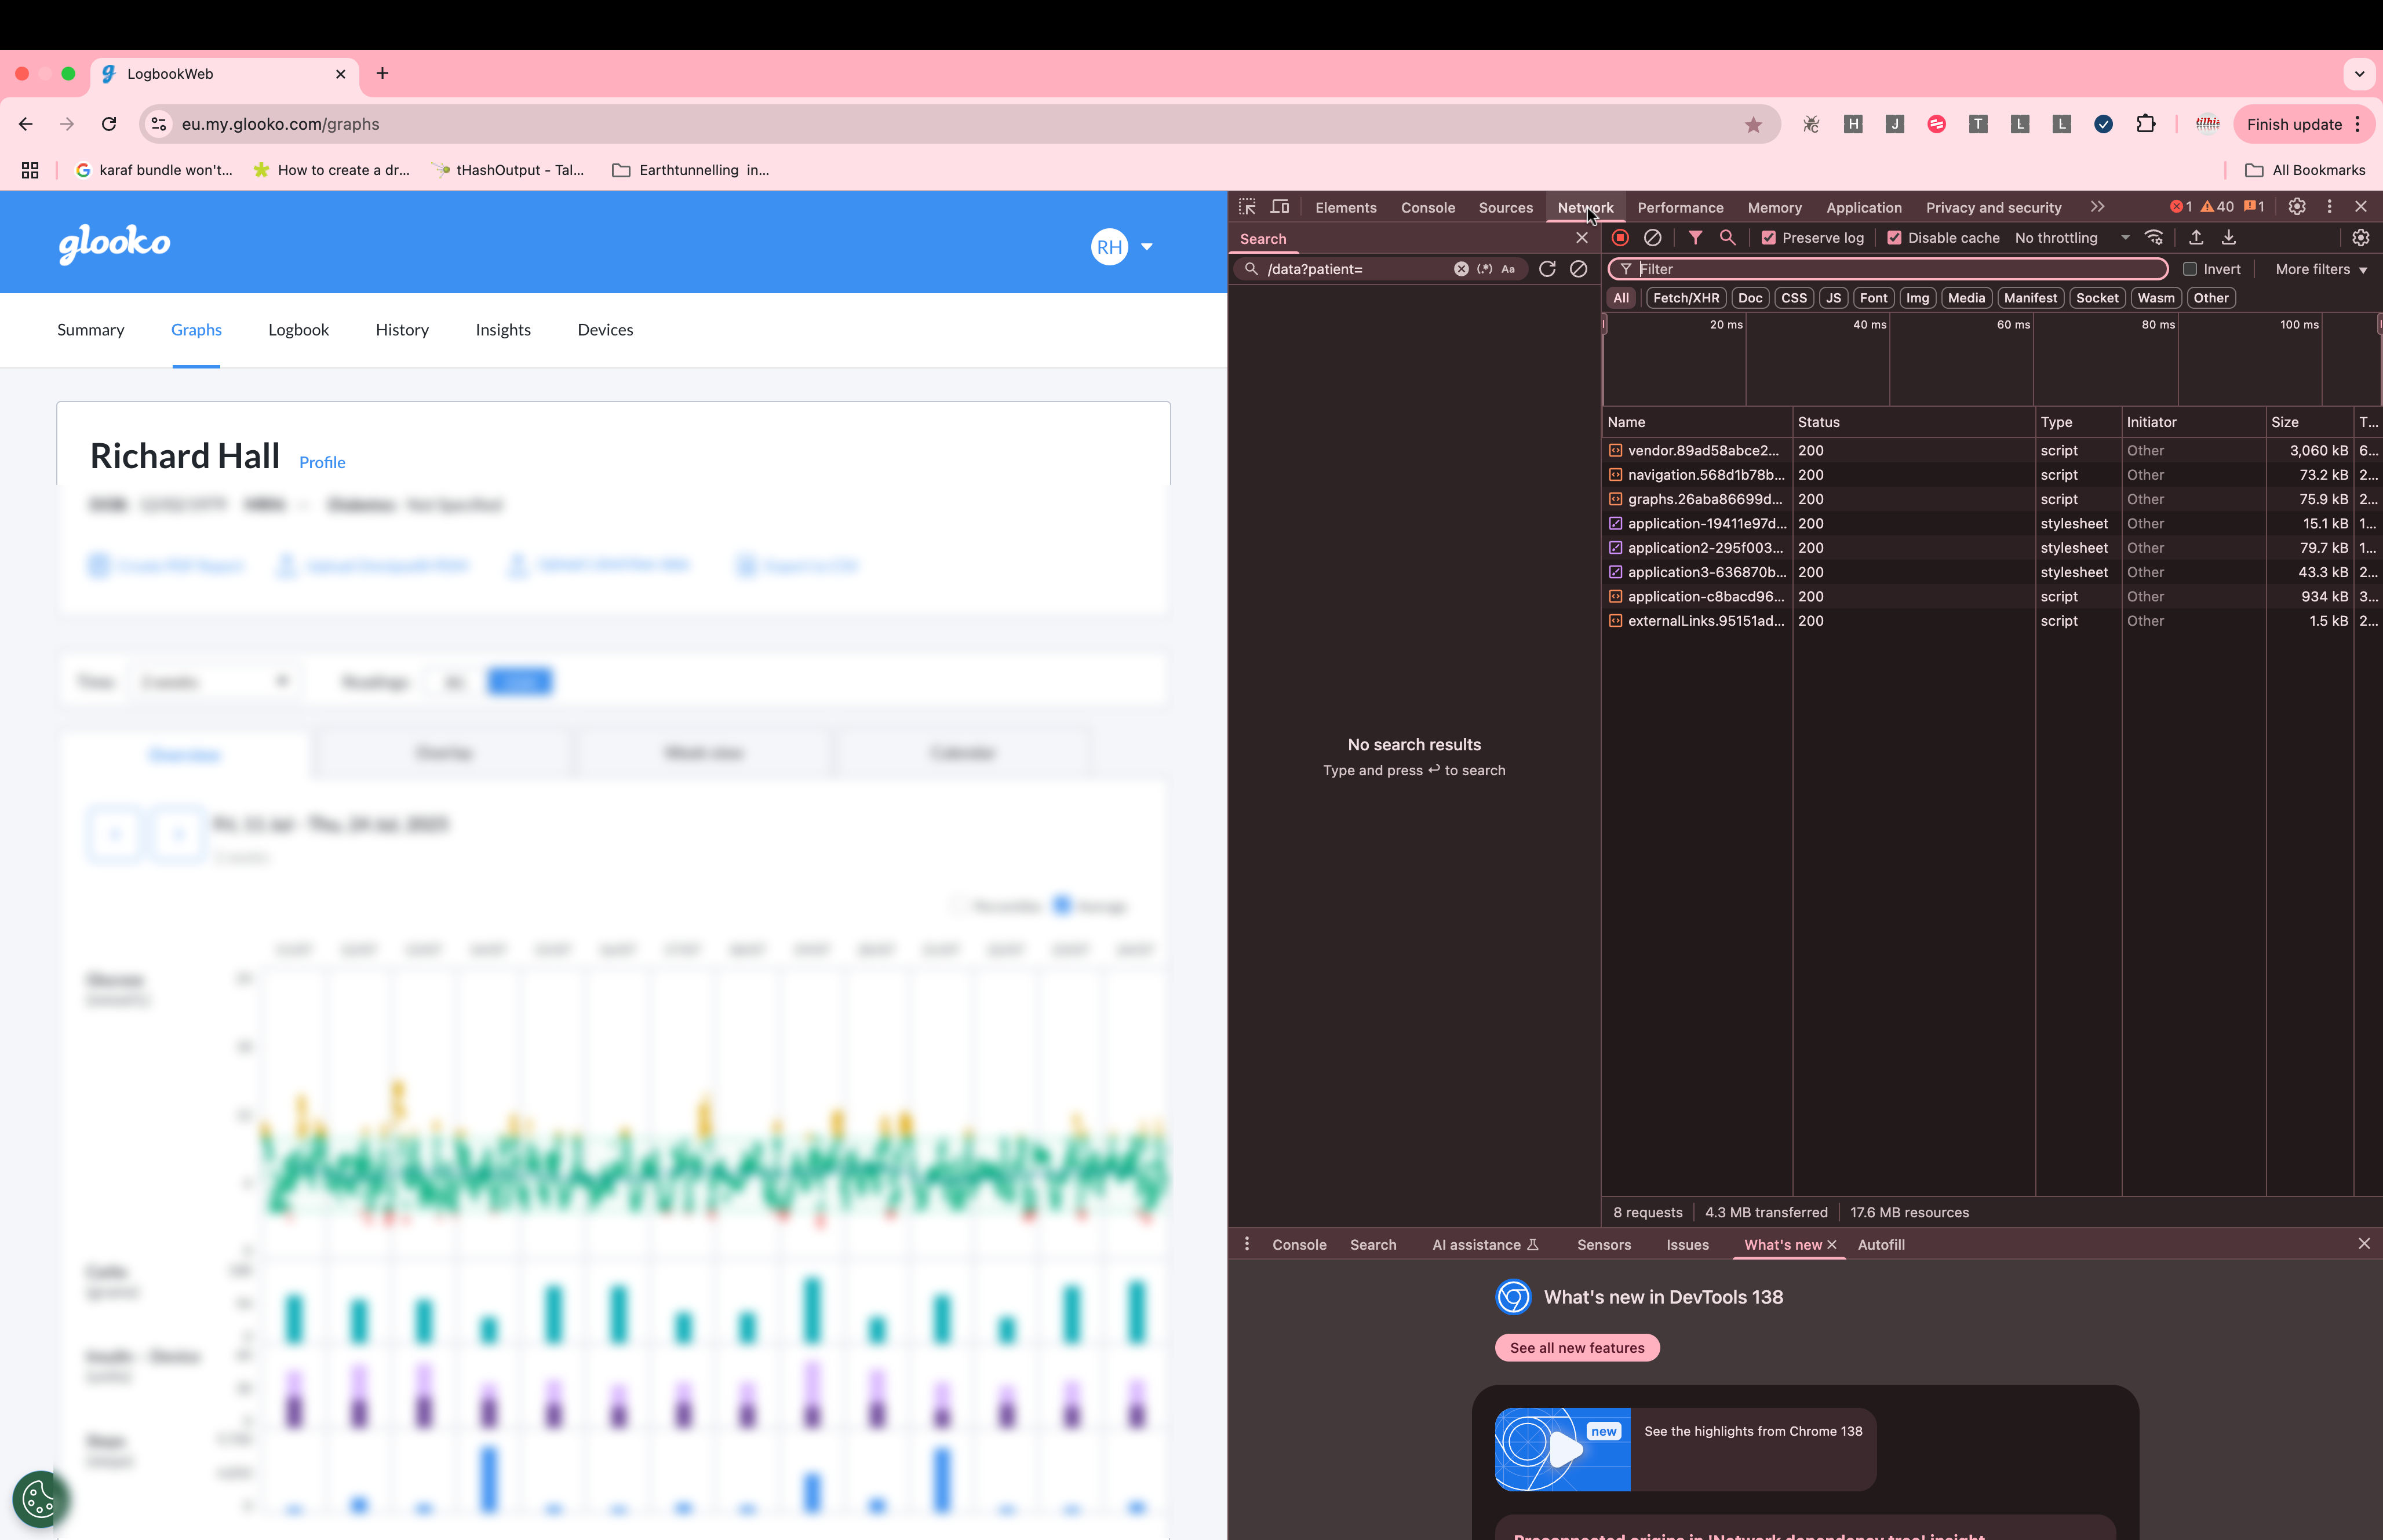
-
Reload the page (
Cmd + RorF5) to capture the network traffic. -
In the filter/search bar, type
/data?patients=
This narrows the requests down to the one you want.
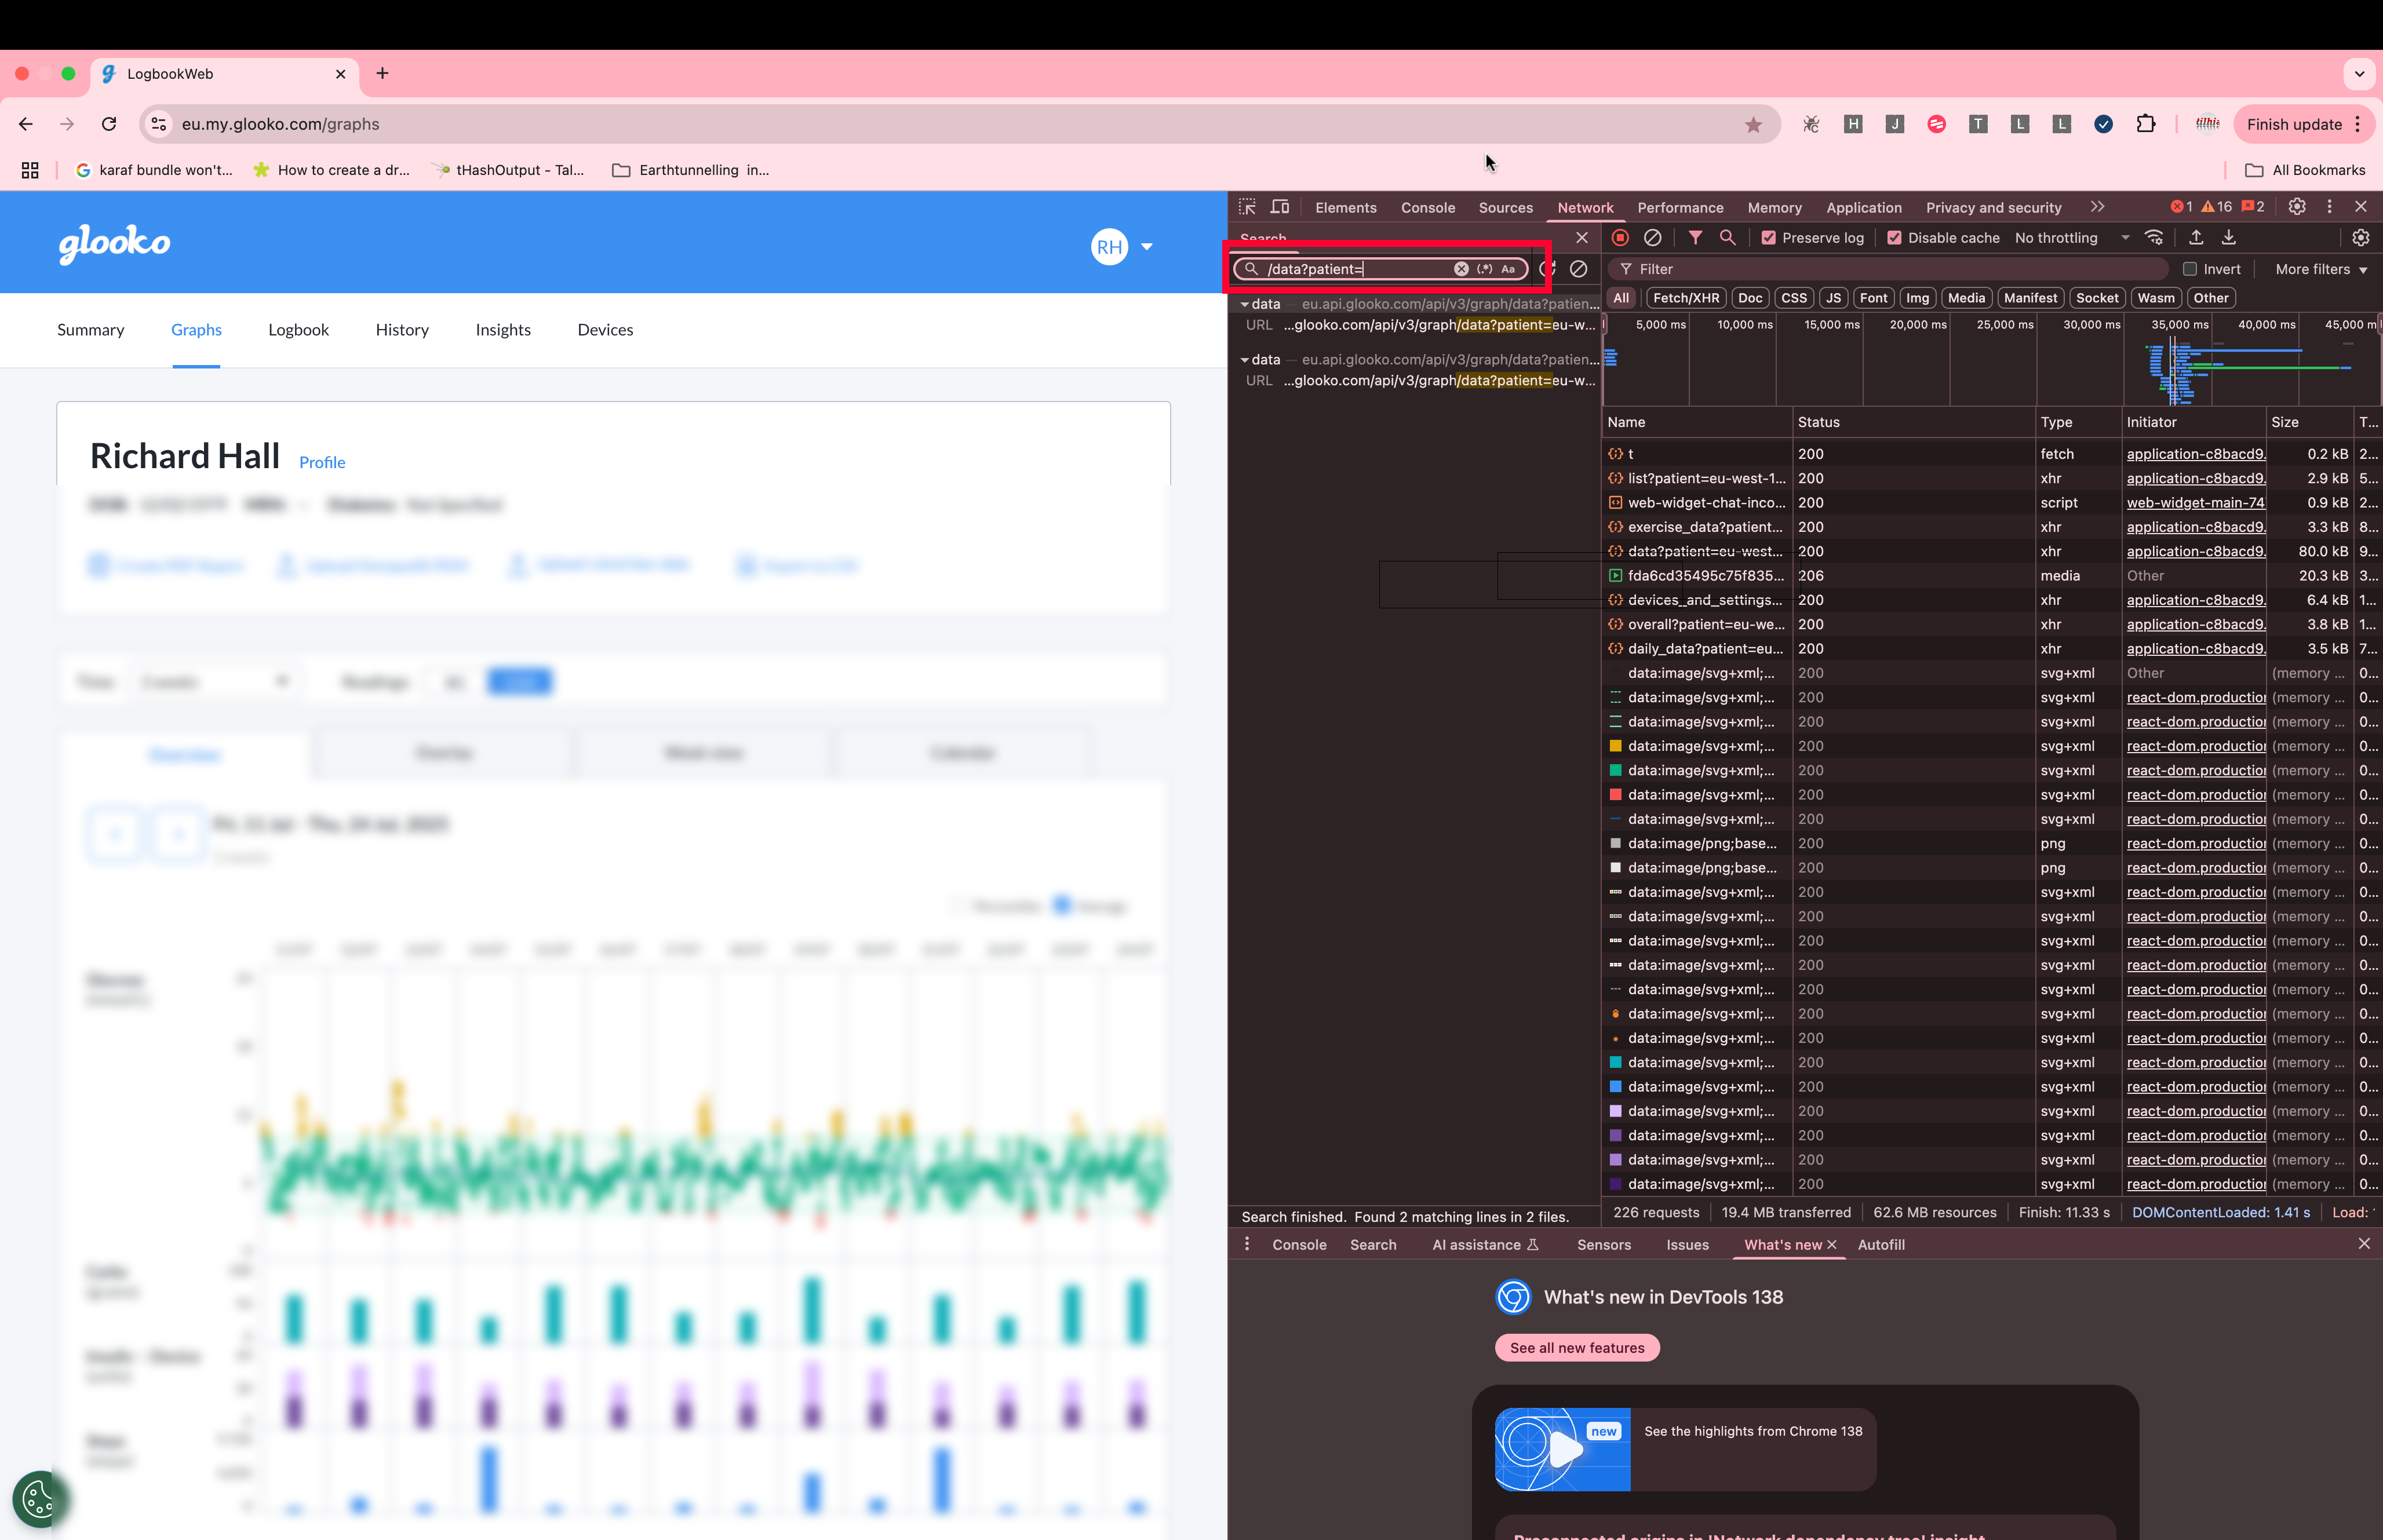
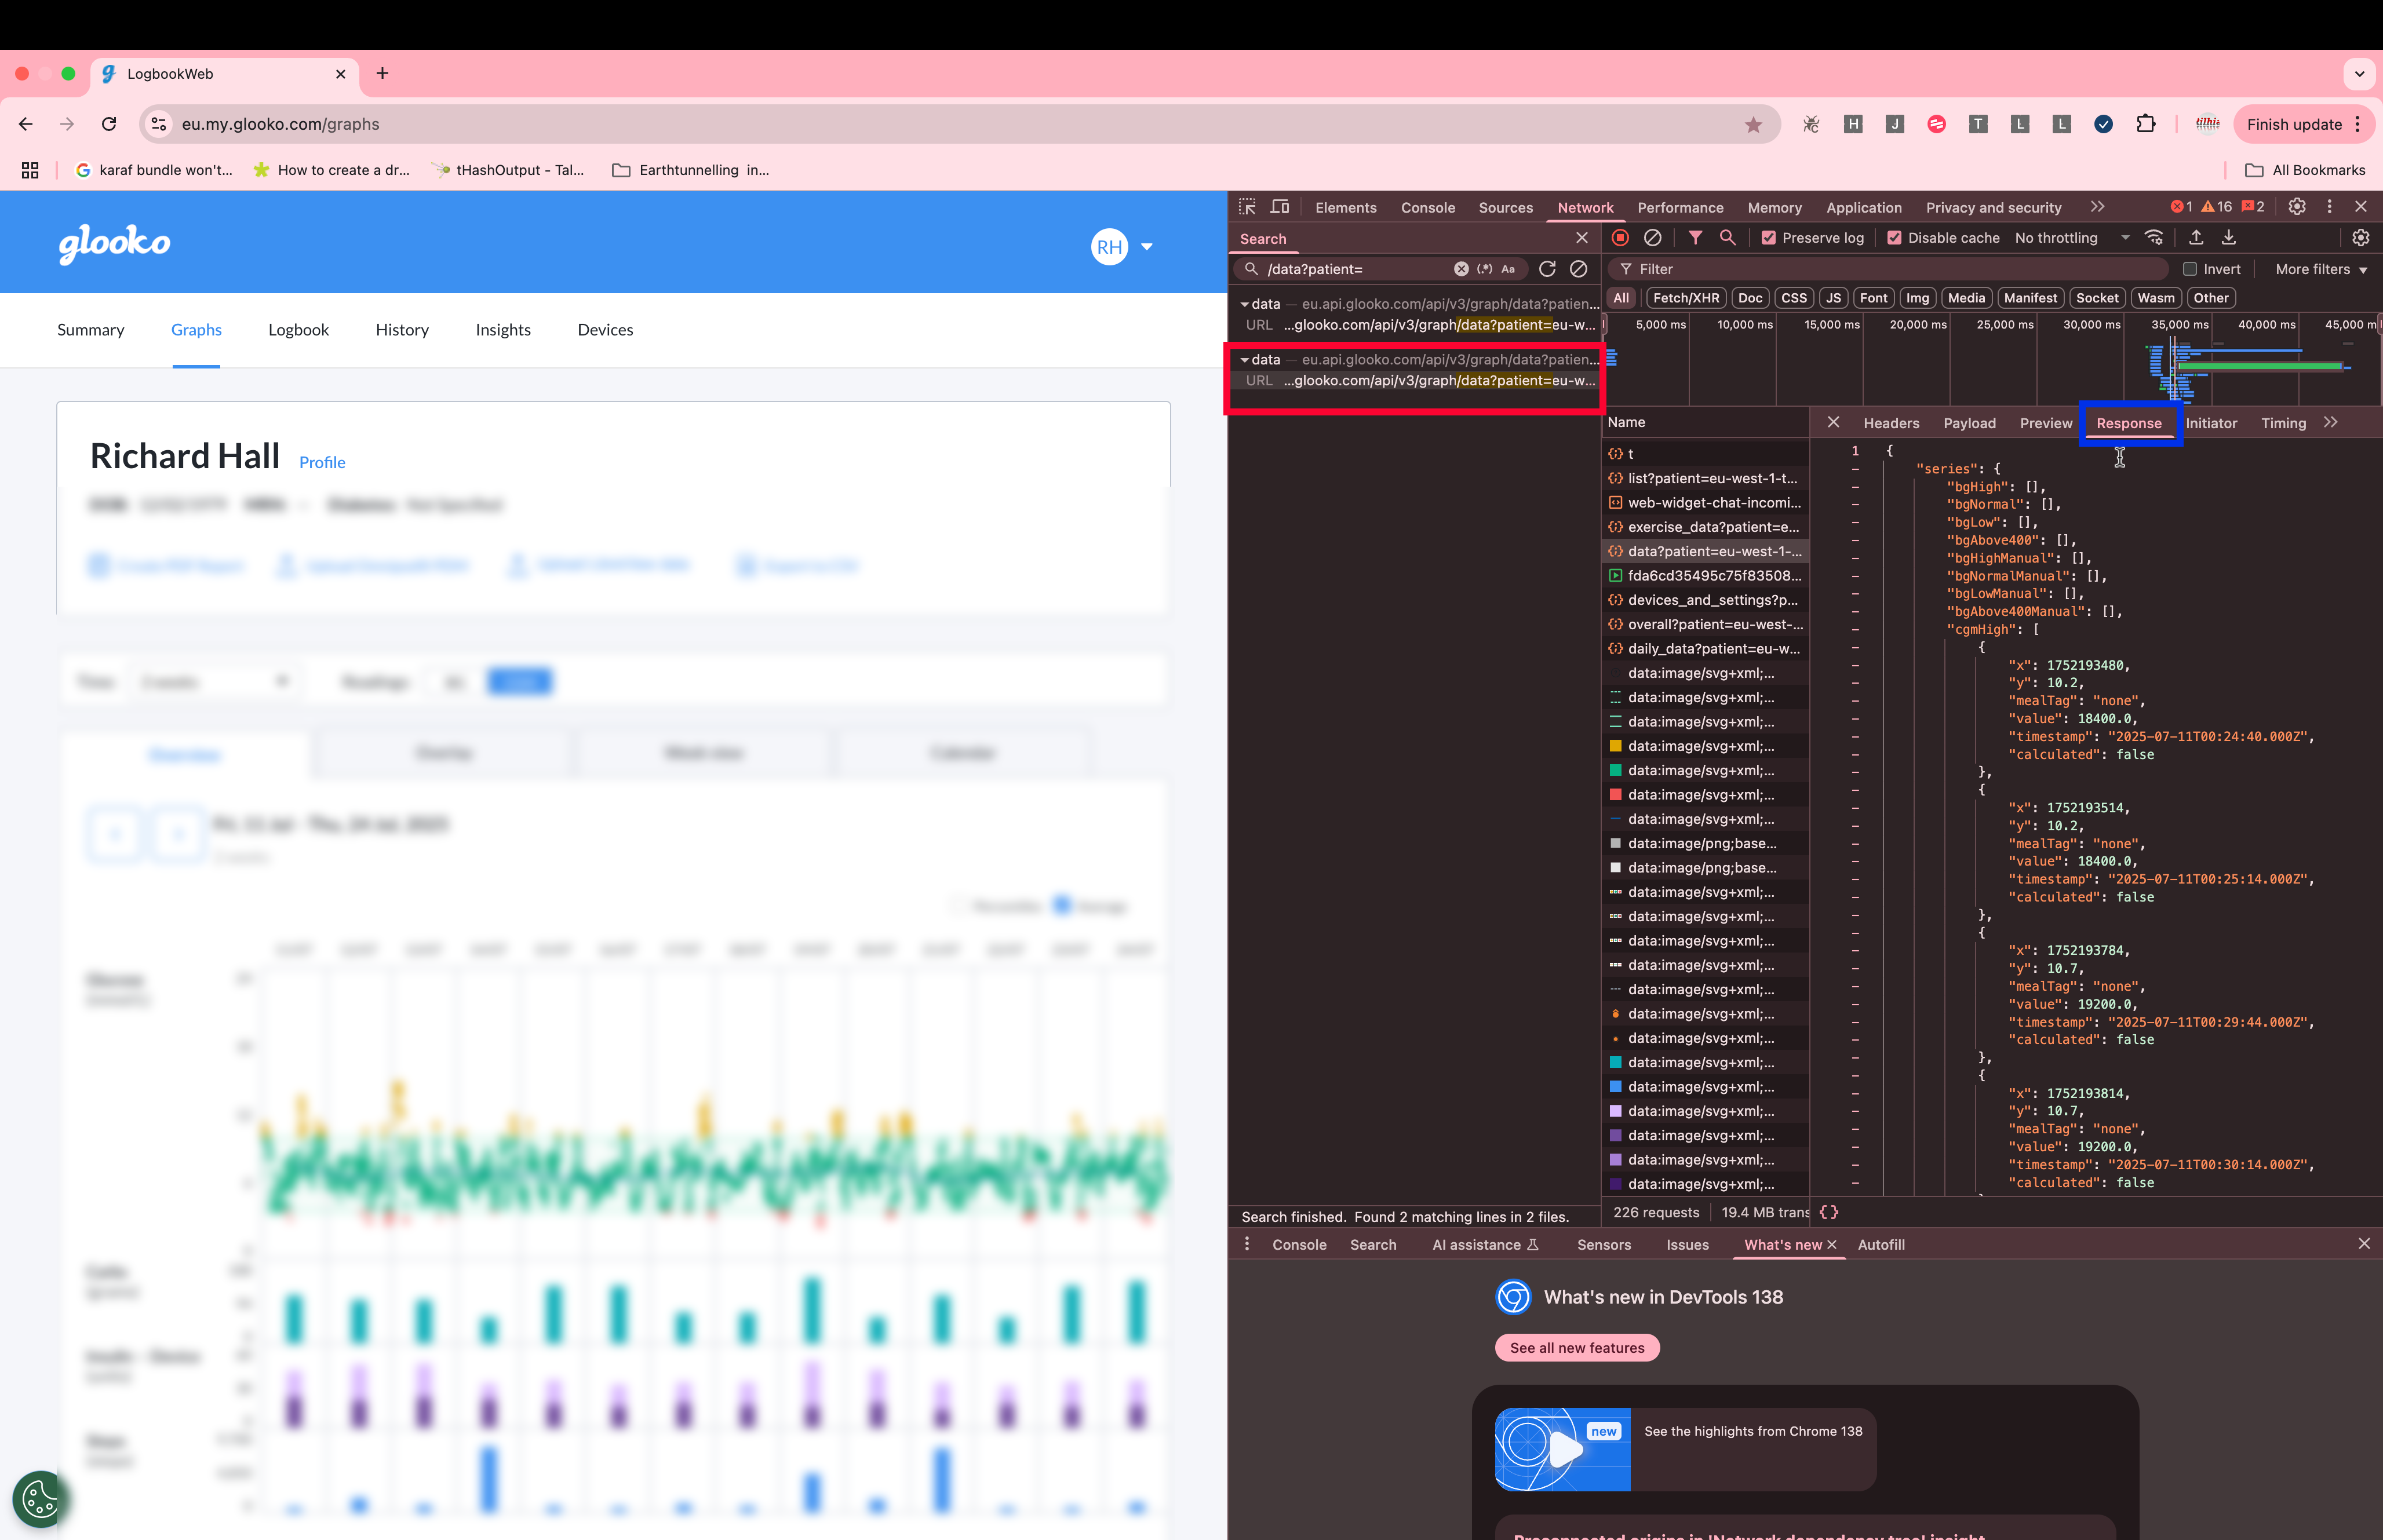
-
You’ll see one, two, possibly many results. Click on each one and inspect the Response tab.
The one that contains JSON data is the one you want.
-
Go to the Headers tab of that request and copy the Request URL.
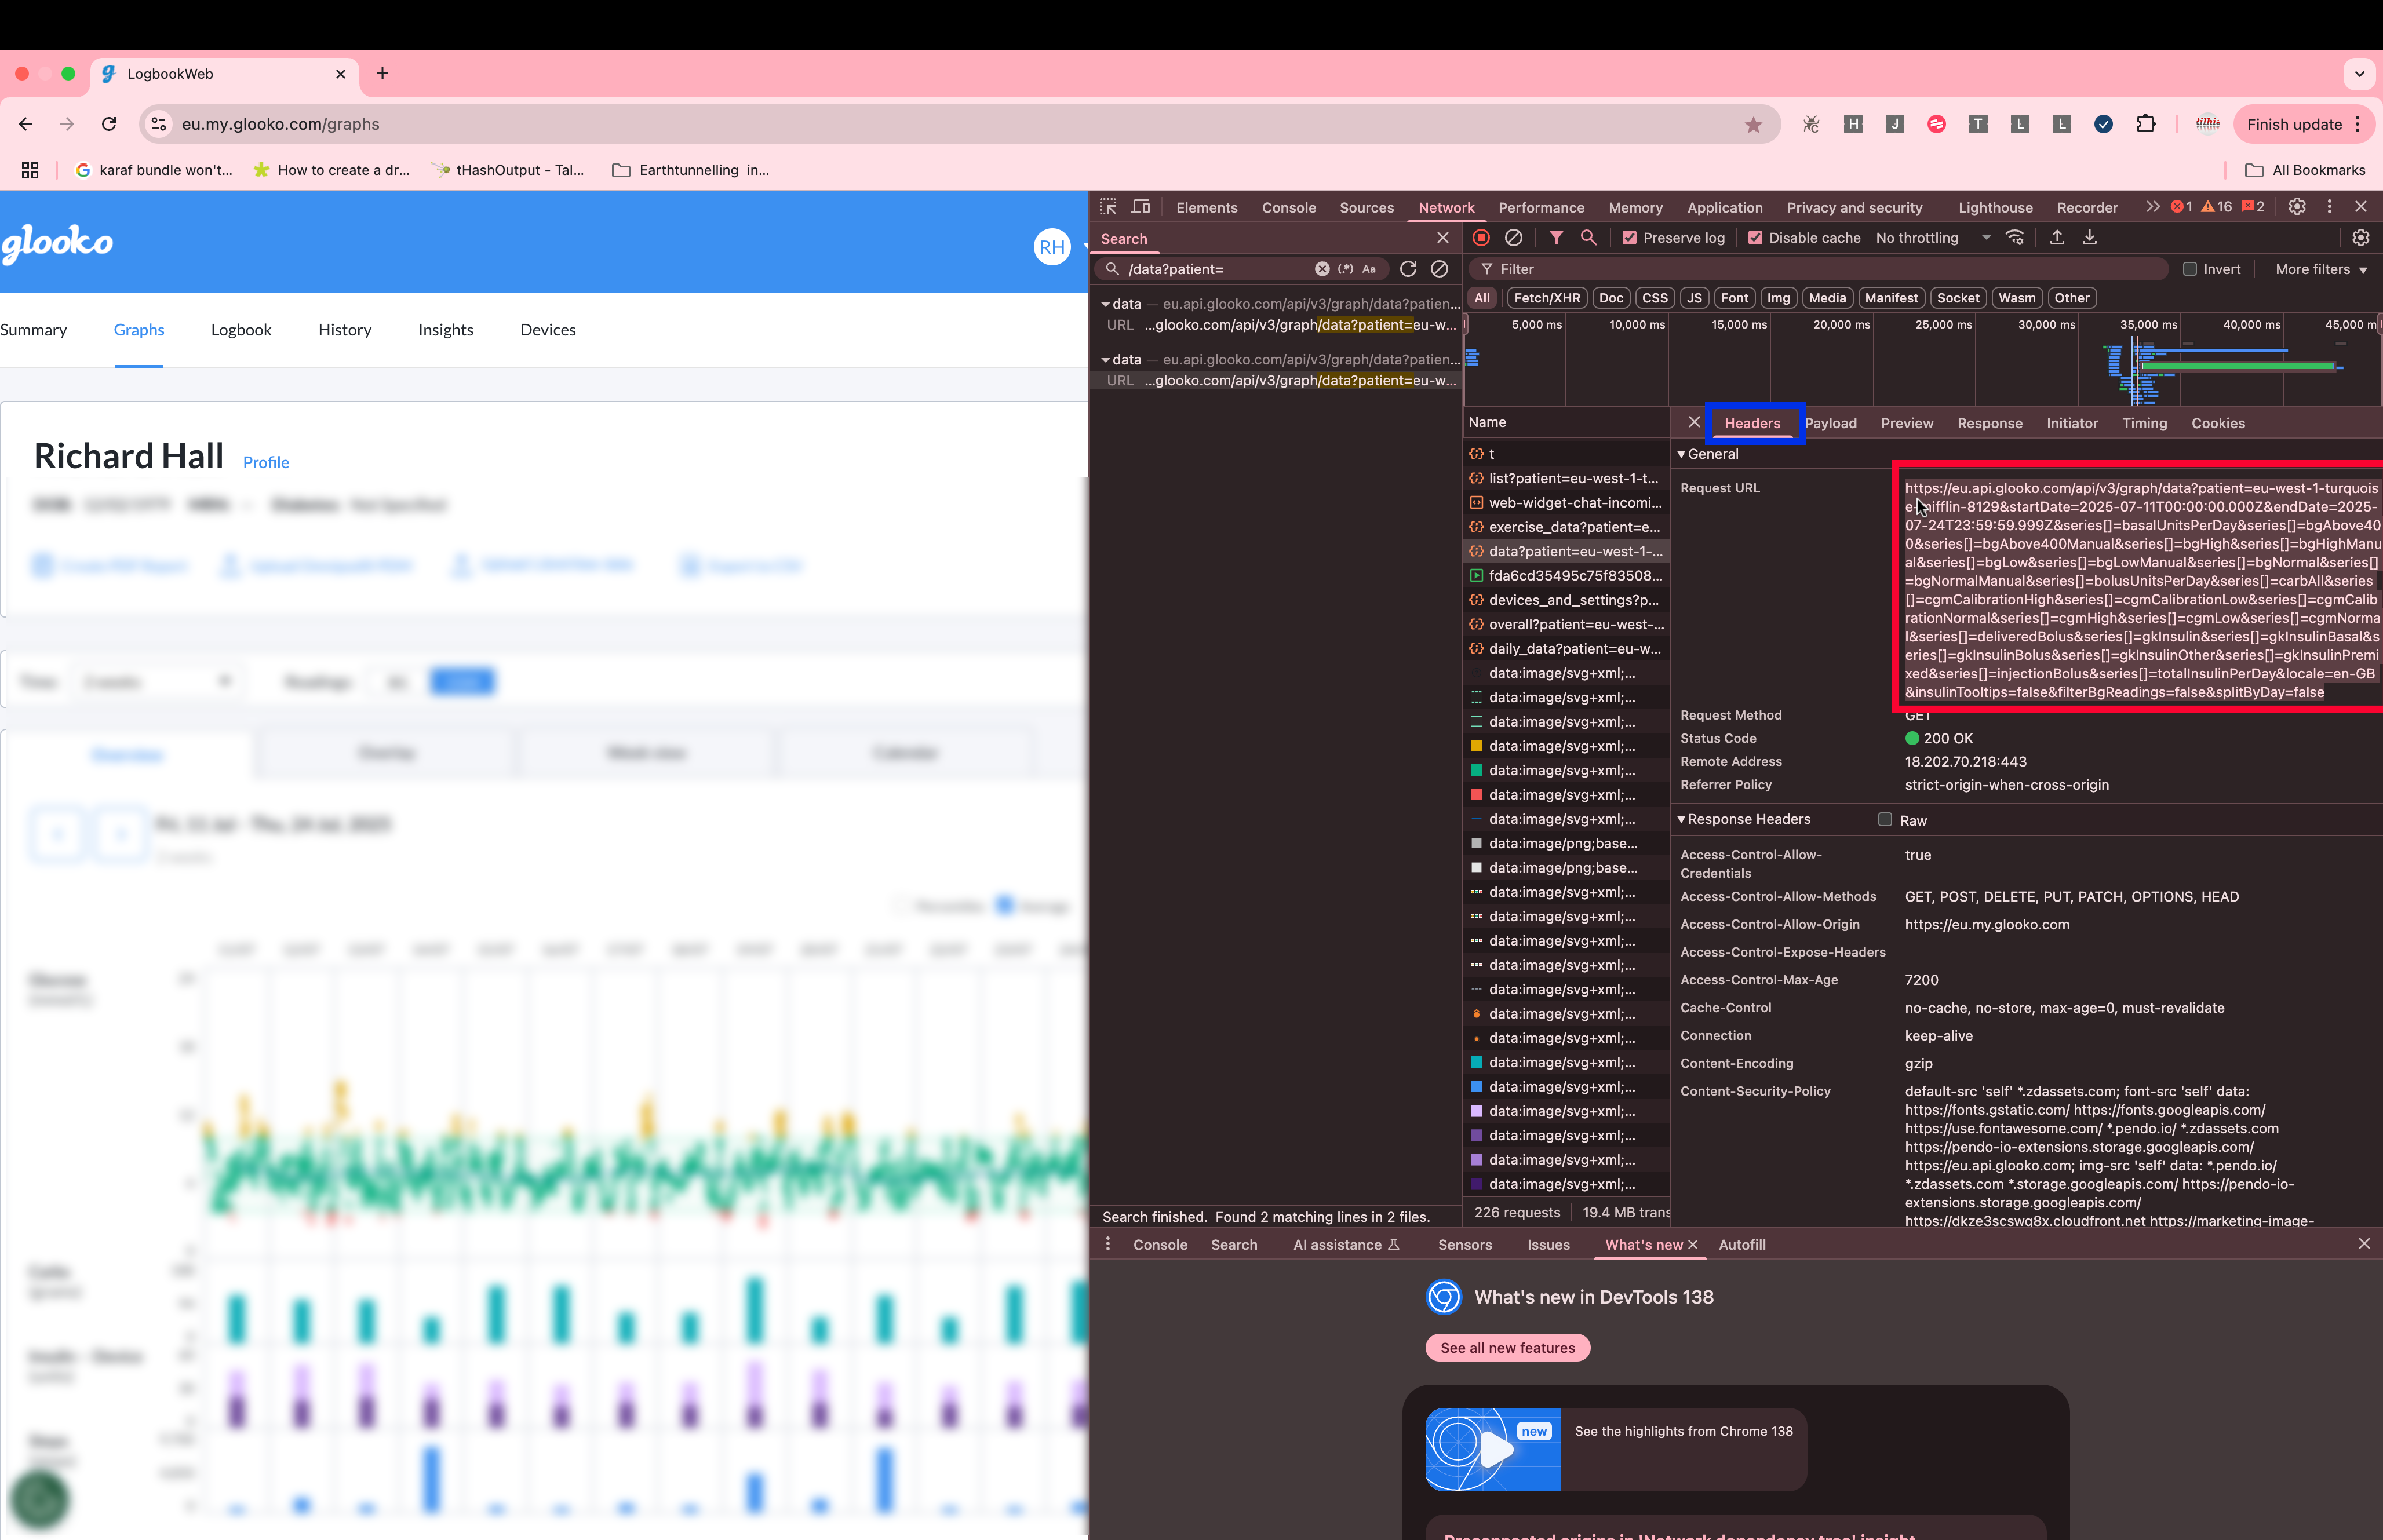
-
Paste the URL into a text editor. It’s long, so this will help you edit it cleanly.
Look for a section like this:startDate=2025-07-07T00:00:00.000Z&endDate=2025-07-20T23:59:59.999Z
-
Modify the
startDateandendDateto match the time range you want.
For example, changing thestartDateyear from 2025 to 2023 allows us to pull an extra two years’ worth of data:startDate=2023-07-07T00:00:00.000Z&endDate=2025-07-20T23:59:59.999Z
-
Now, paste the edited URL into your browser’s address bar, in a tab where you’re still logged into Glooko.
Hit enter.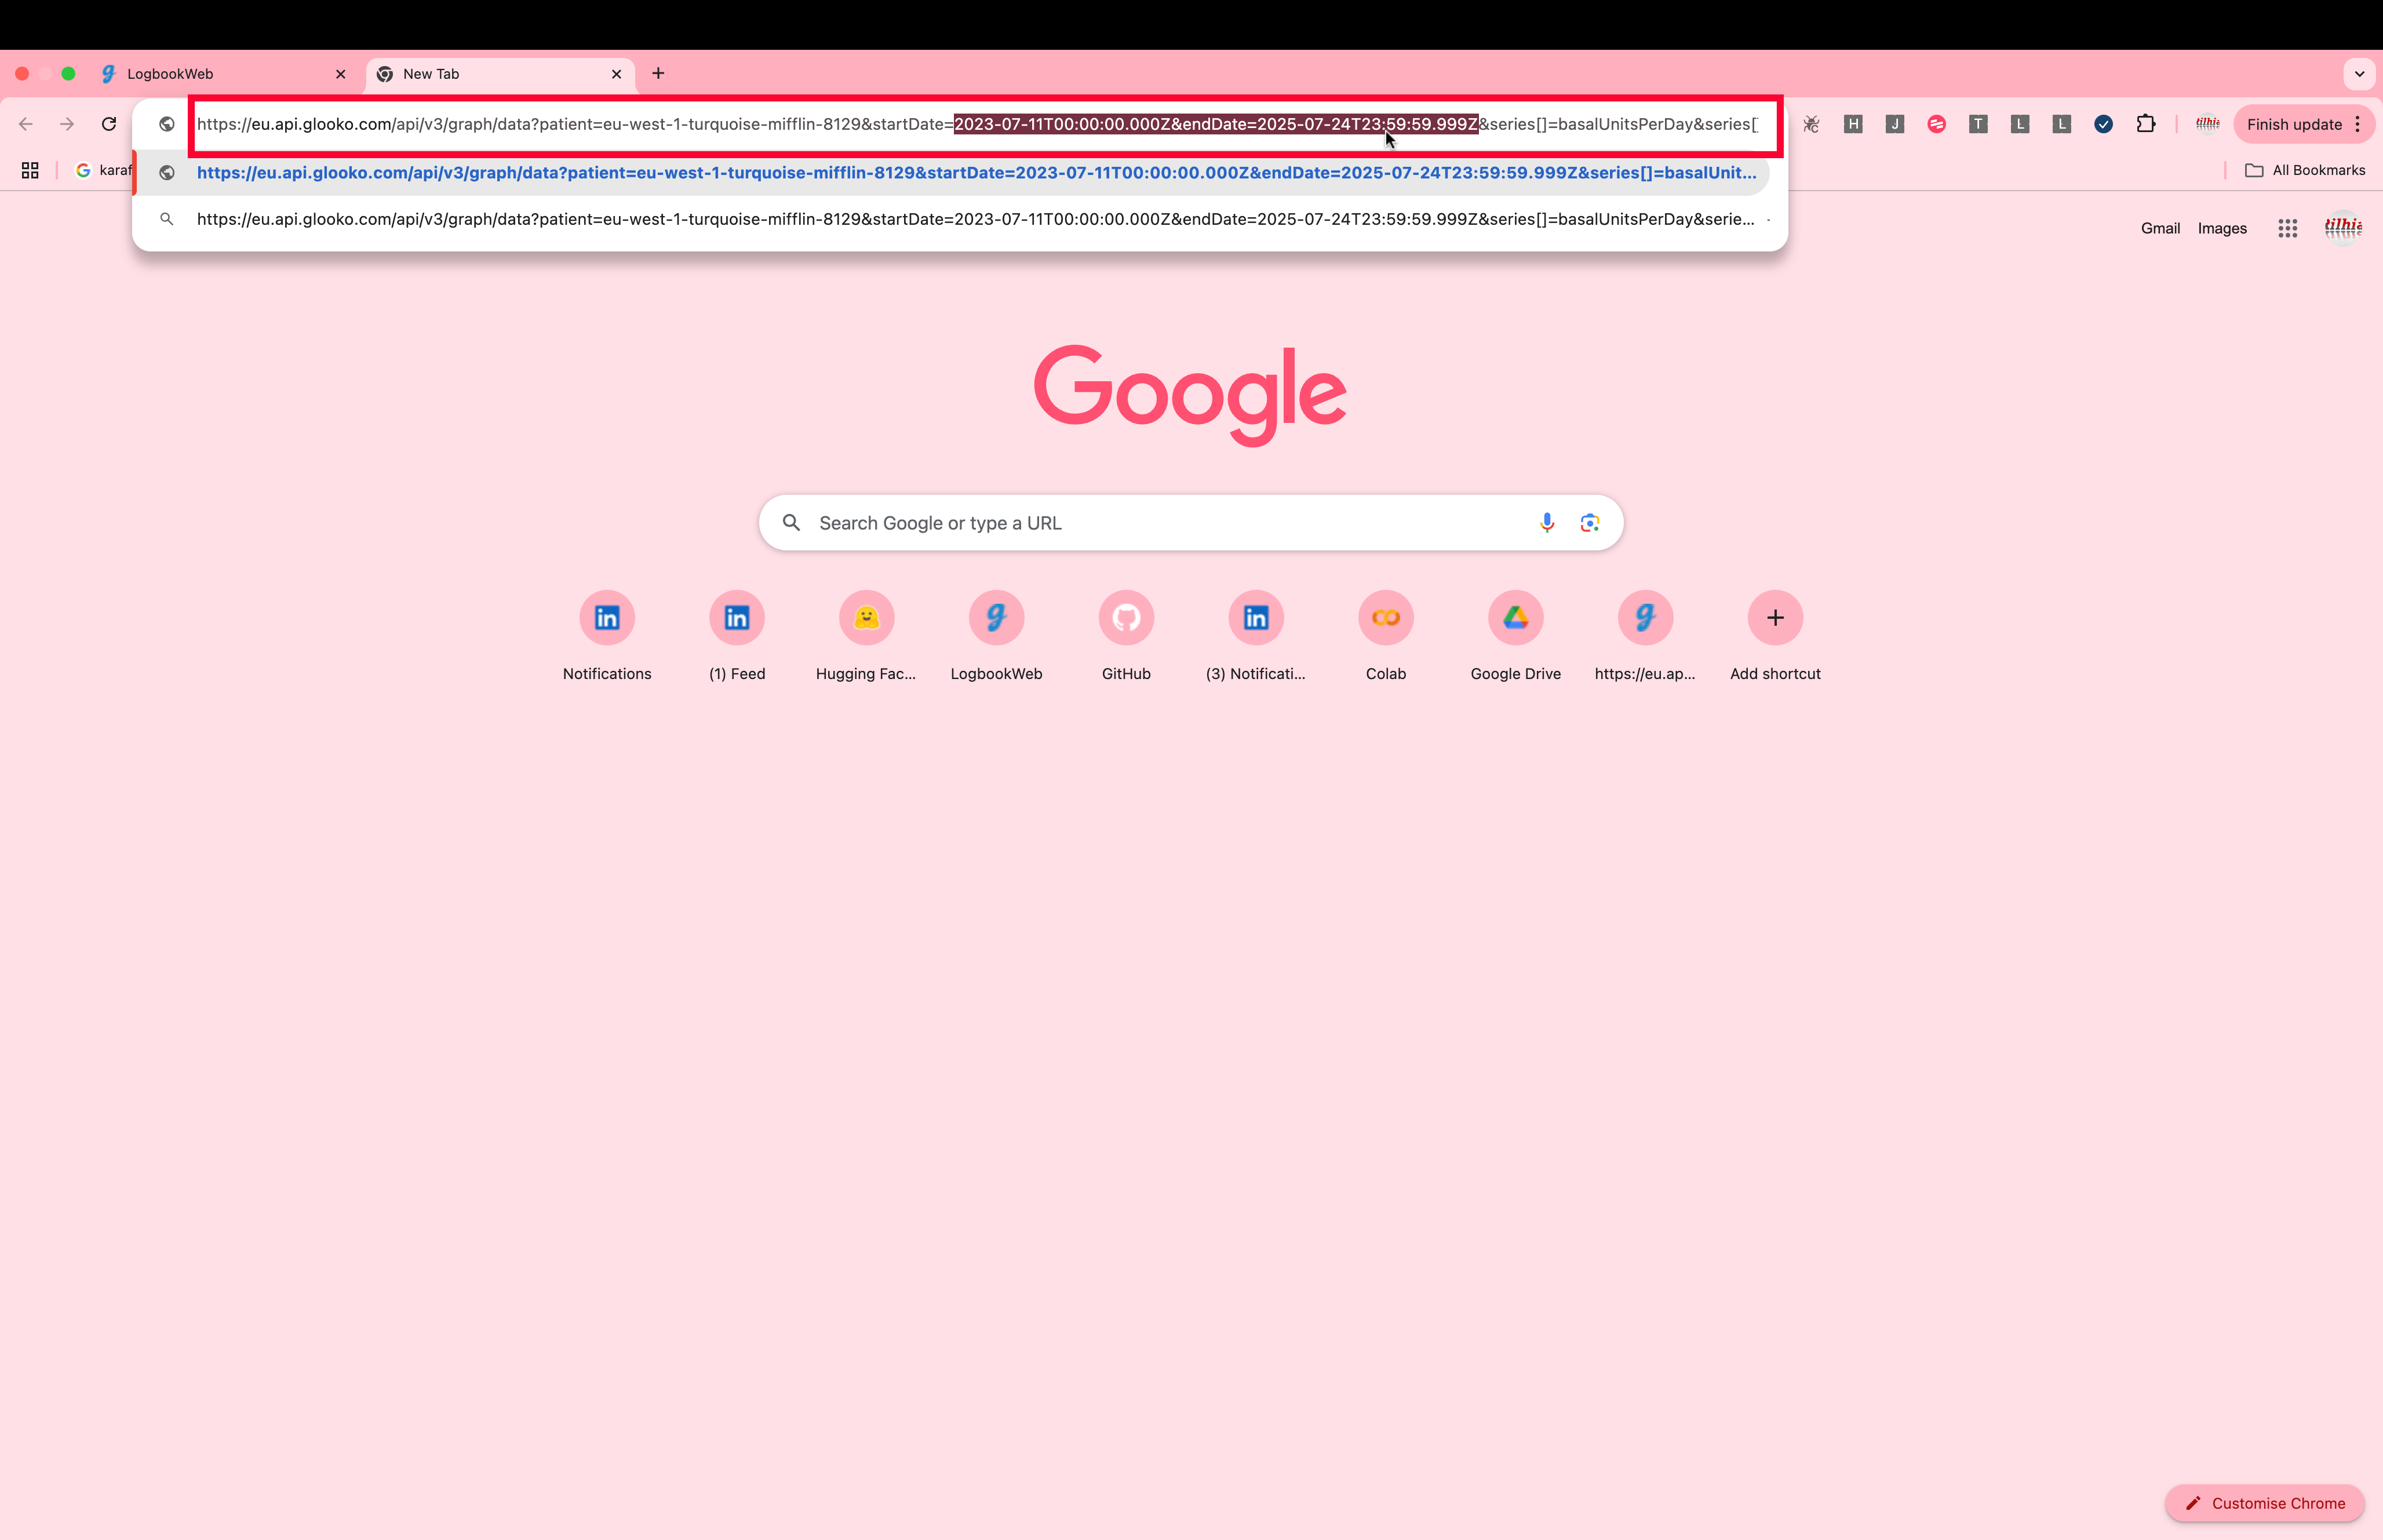
-
Wait a moment. If you’re requesting a lot of data (like 2 years), it may take some time.
When it loads, you’ll see a screen filled with raw JSON text. - Select all the text (
Cmd + A, thenCmd + C) and paste it into your text editor.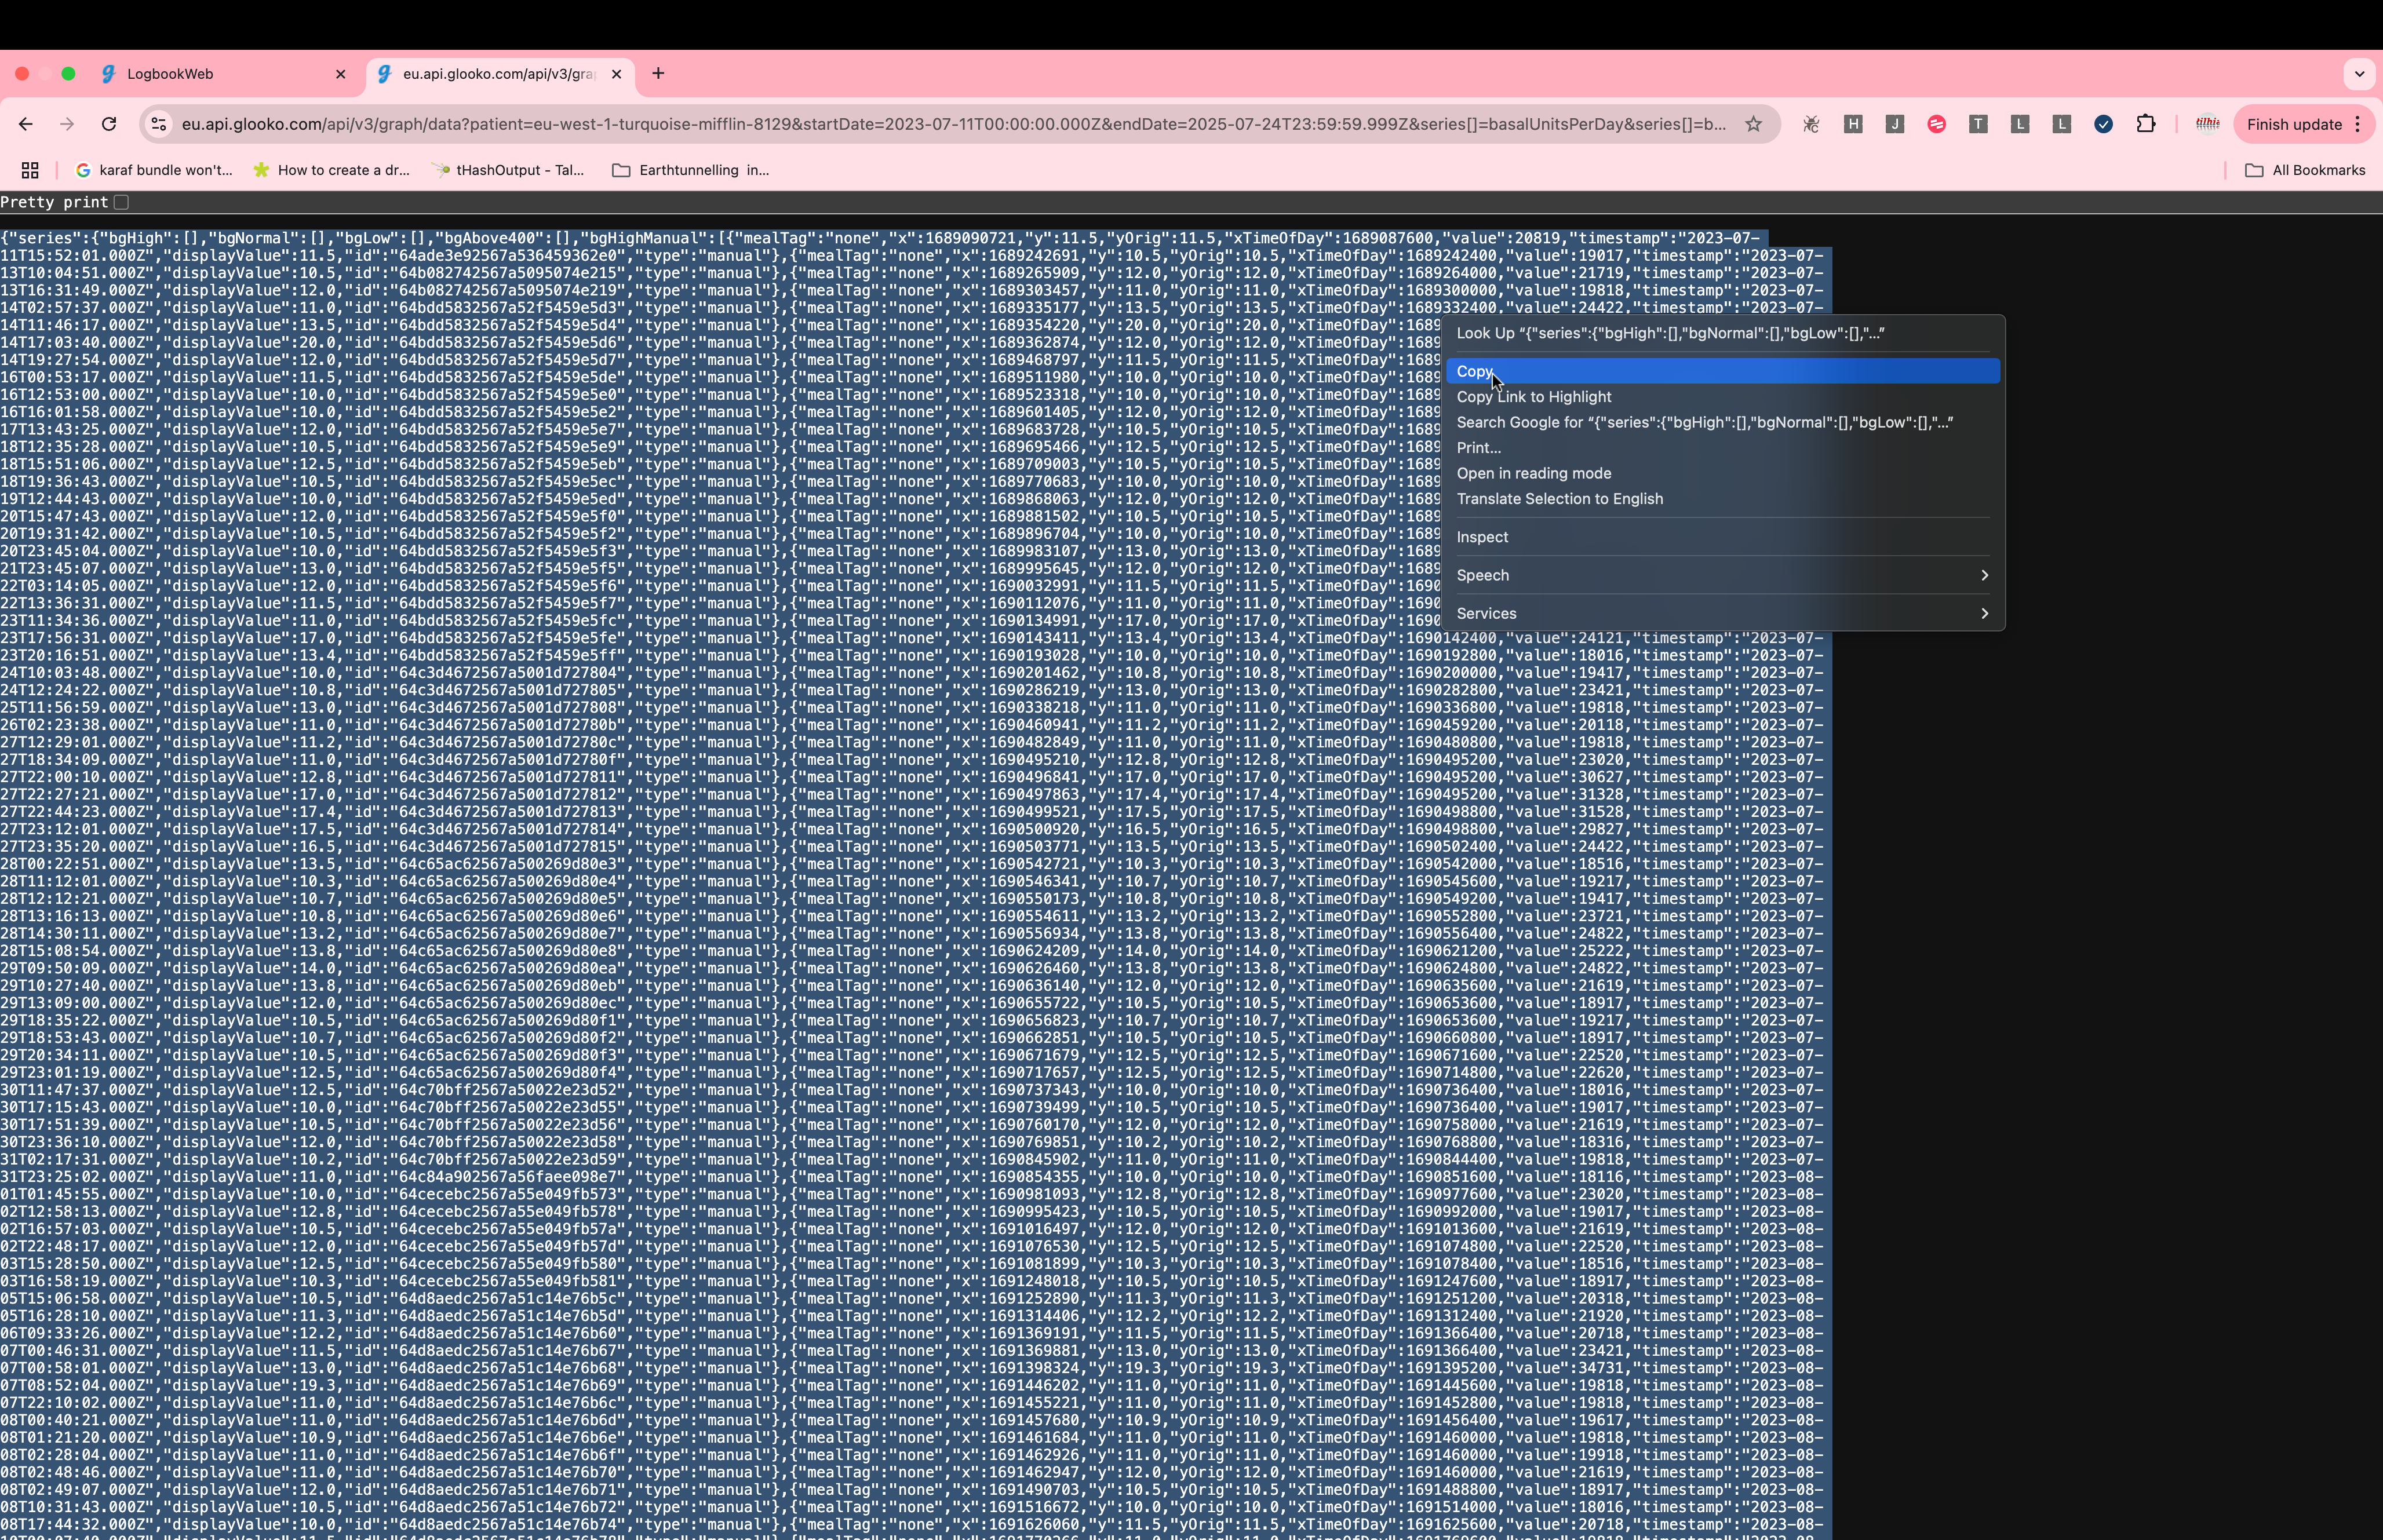
- Save the file with a
.jsonextension (e.g.glooko_data.json).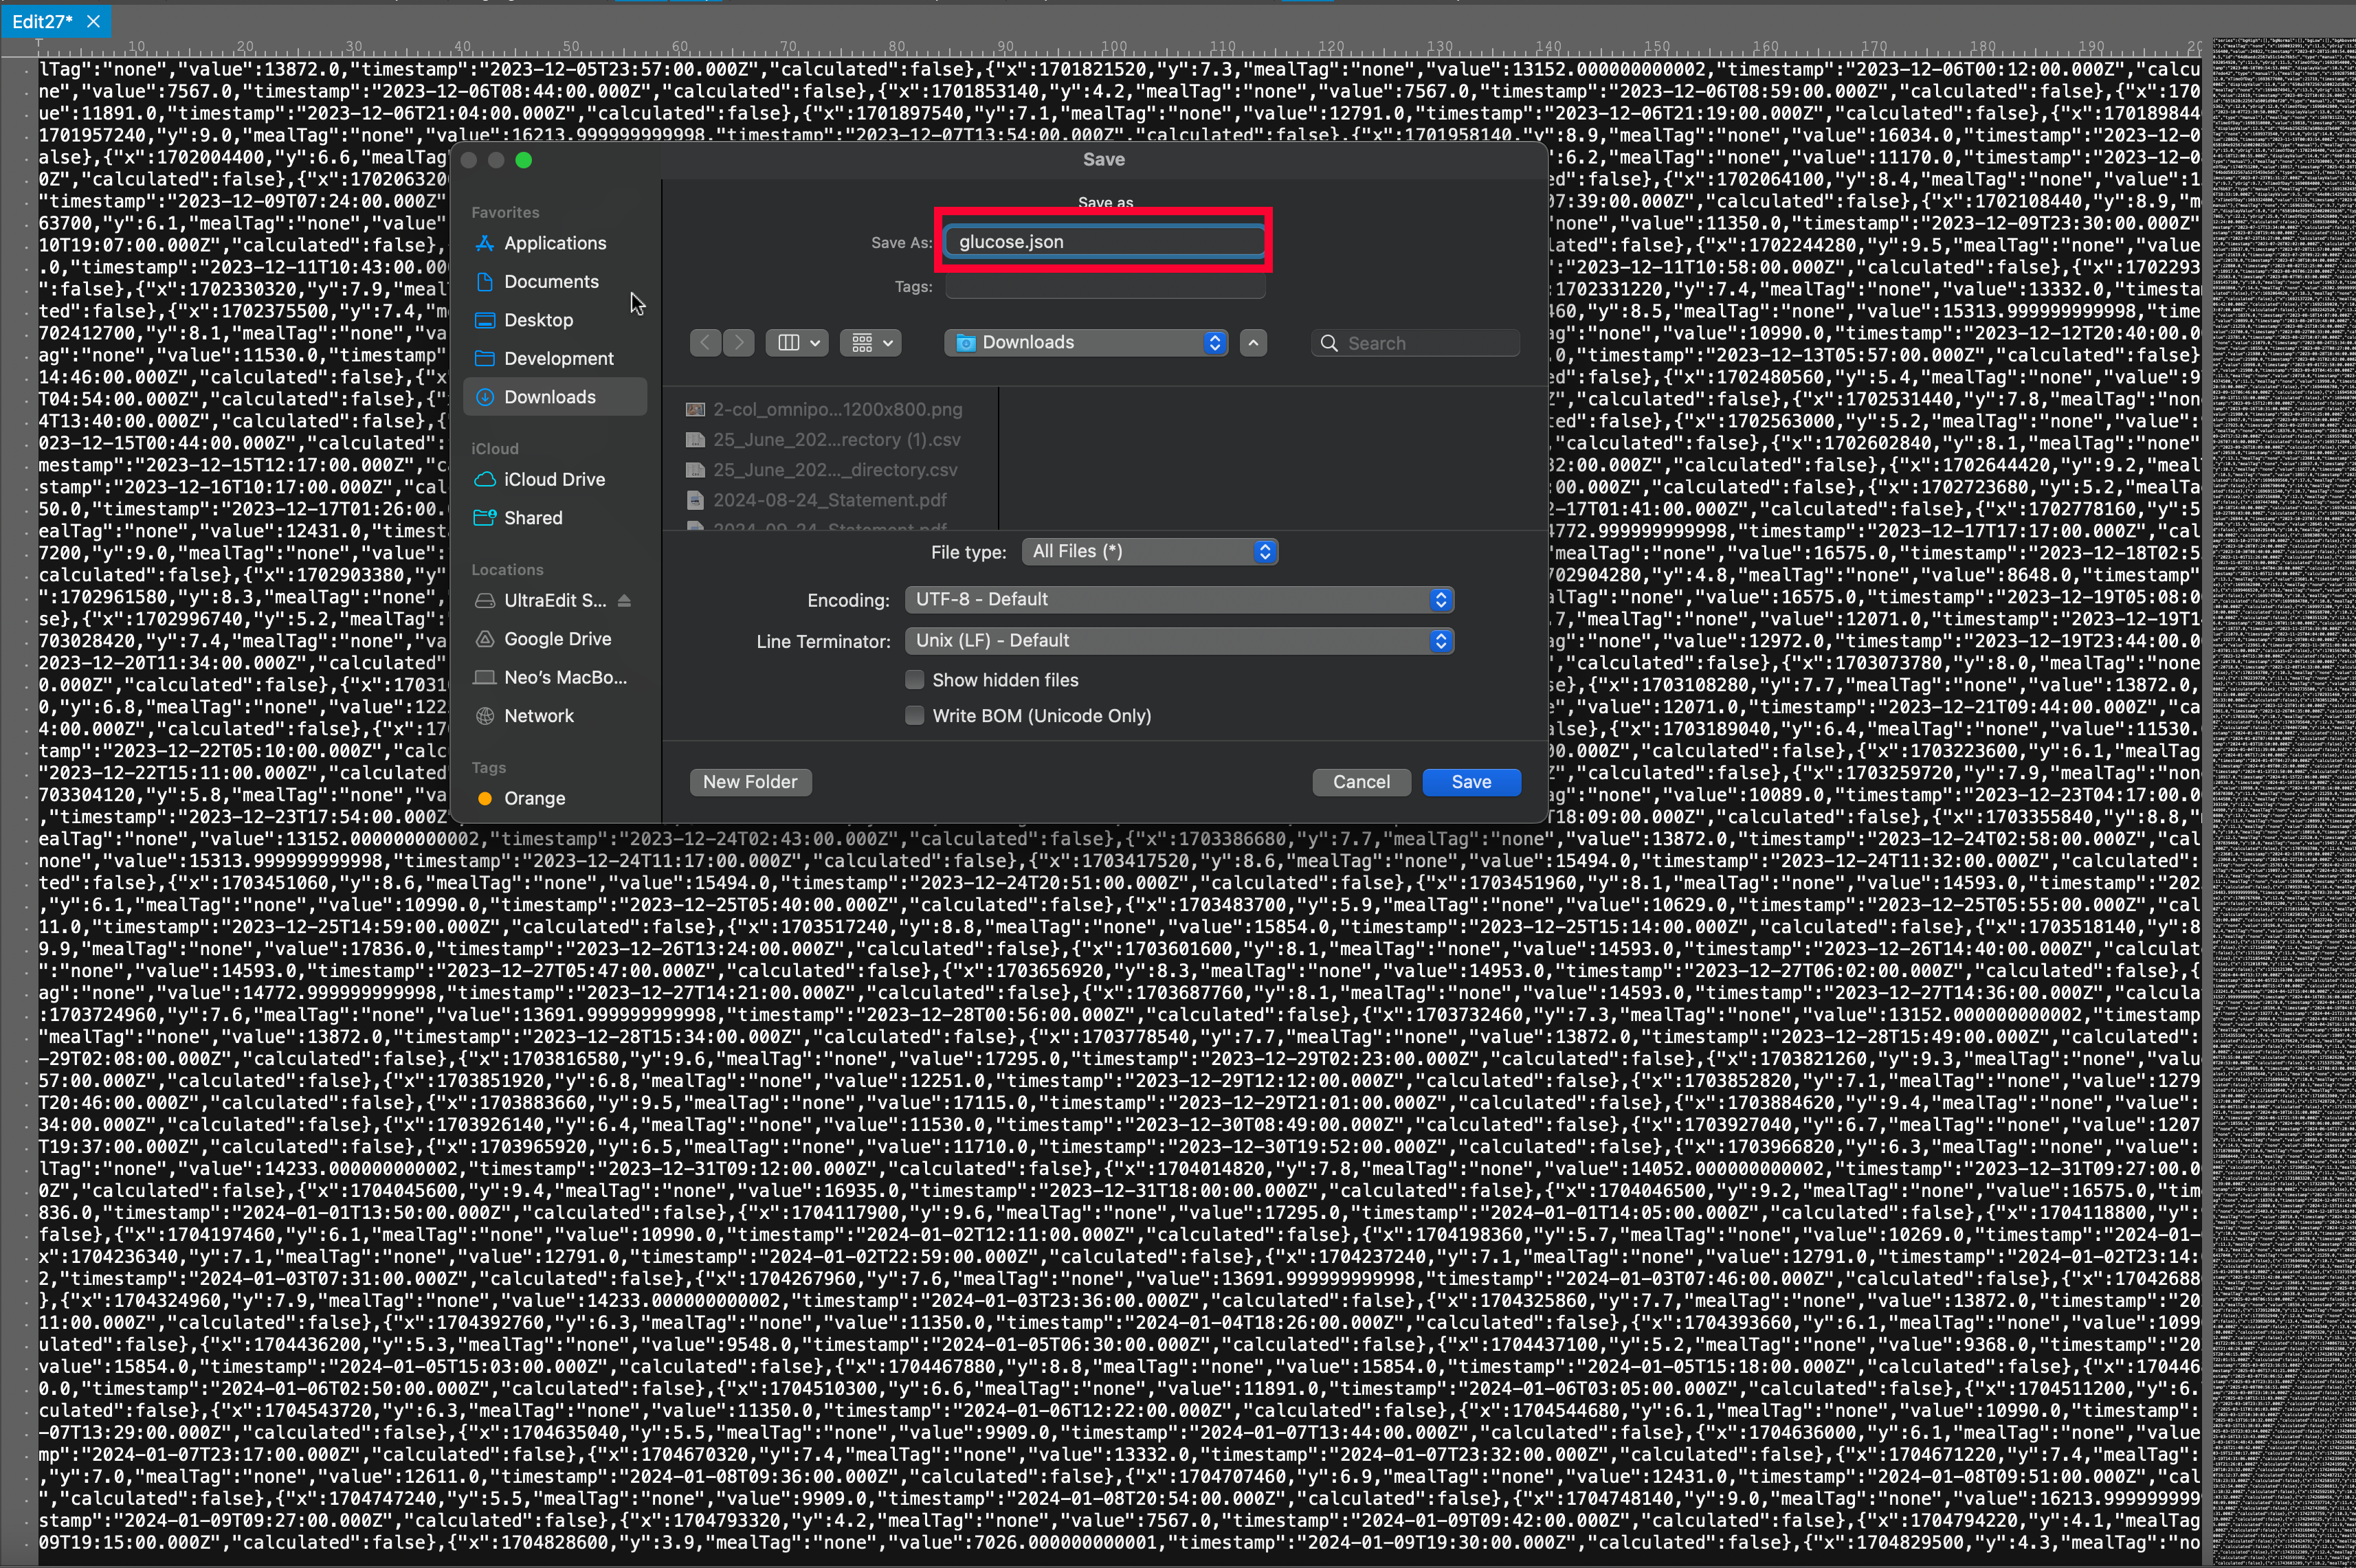
🎉 Done! You’ve now extracted your data. This file can now be used in your own visualisations, backups, or with projects like Glucose Grand Prix.
🚀 How to run Glucose Grand Prix
-
Download and/or open the HTML file Download the webpage or run it from GitHub and double click on it to open it in a browser.
-
Prepare your data
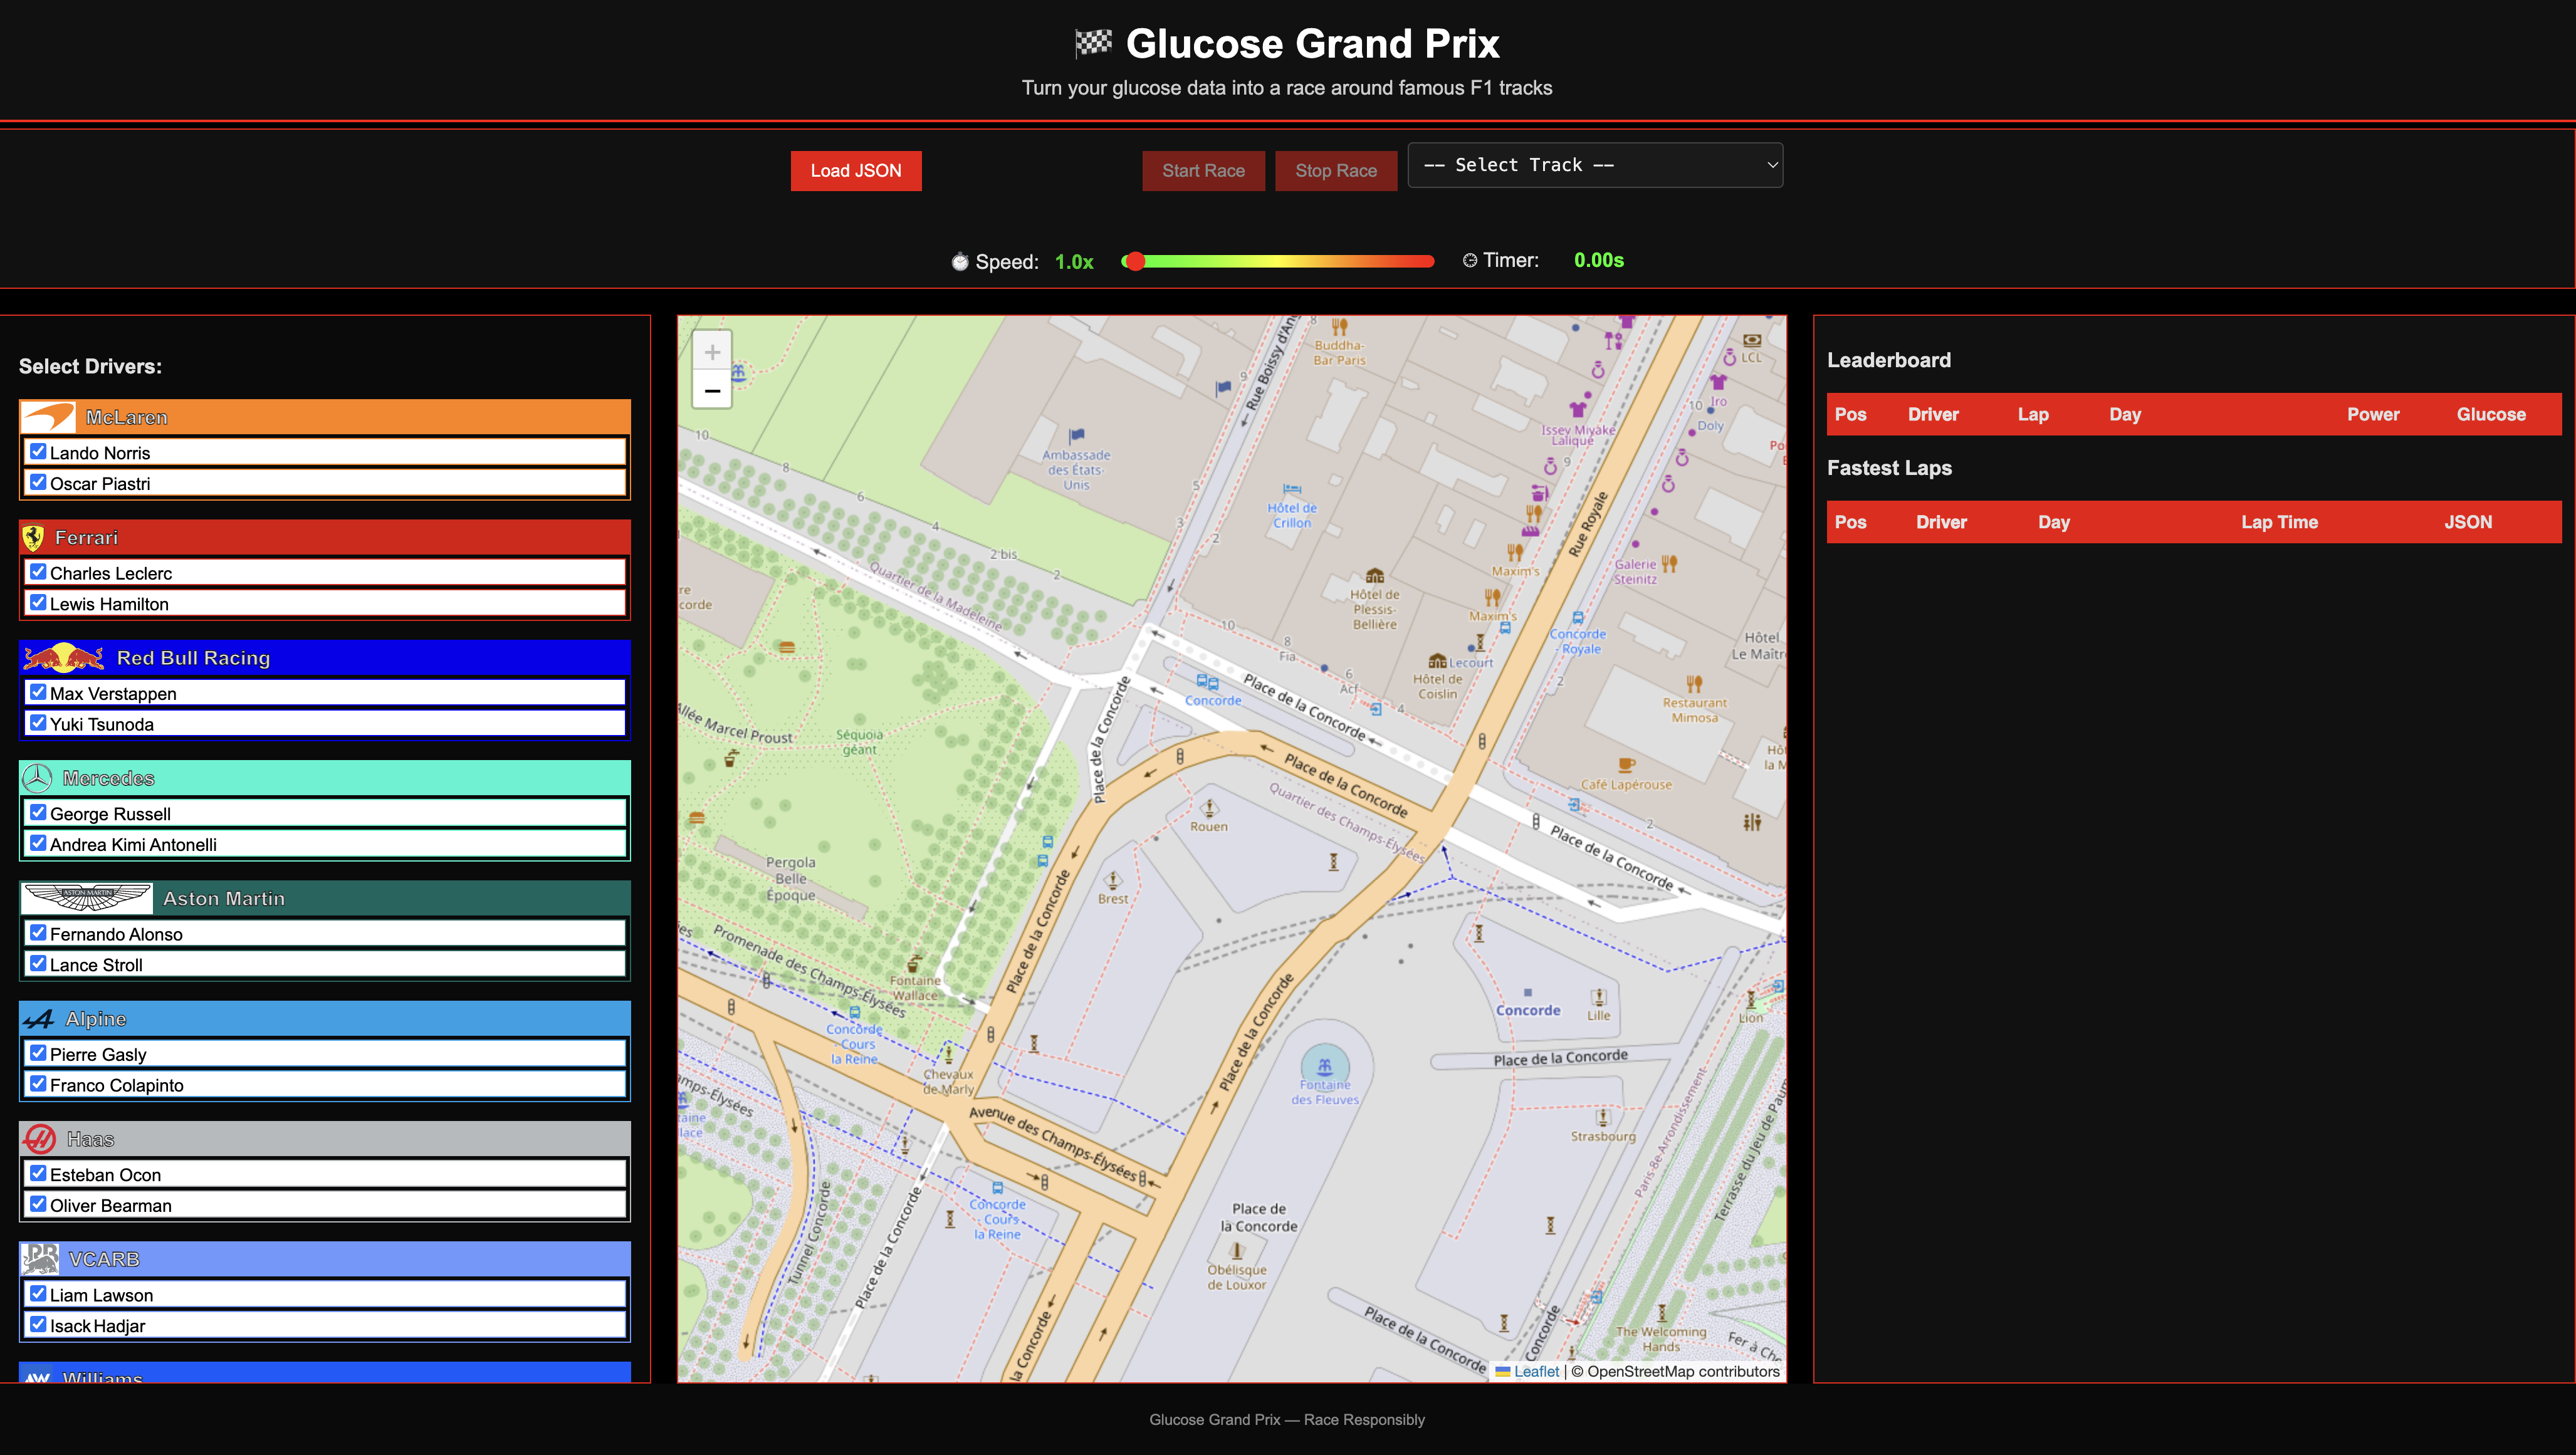
Download your data from Glooko, paste the data into a file, give the file a name with the suffix “.json”, then click “Load JSON” to load it. Instructions shown here. Or you can try this out using some of my data I have uploaded here in a file called glucose.json.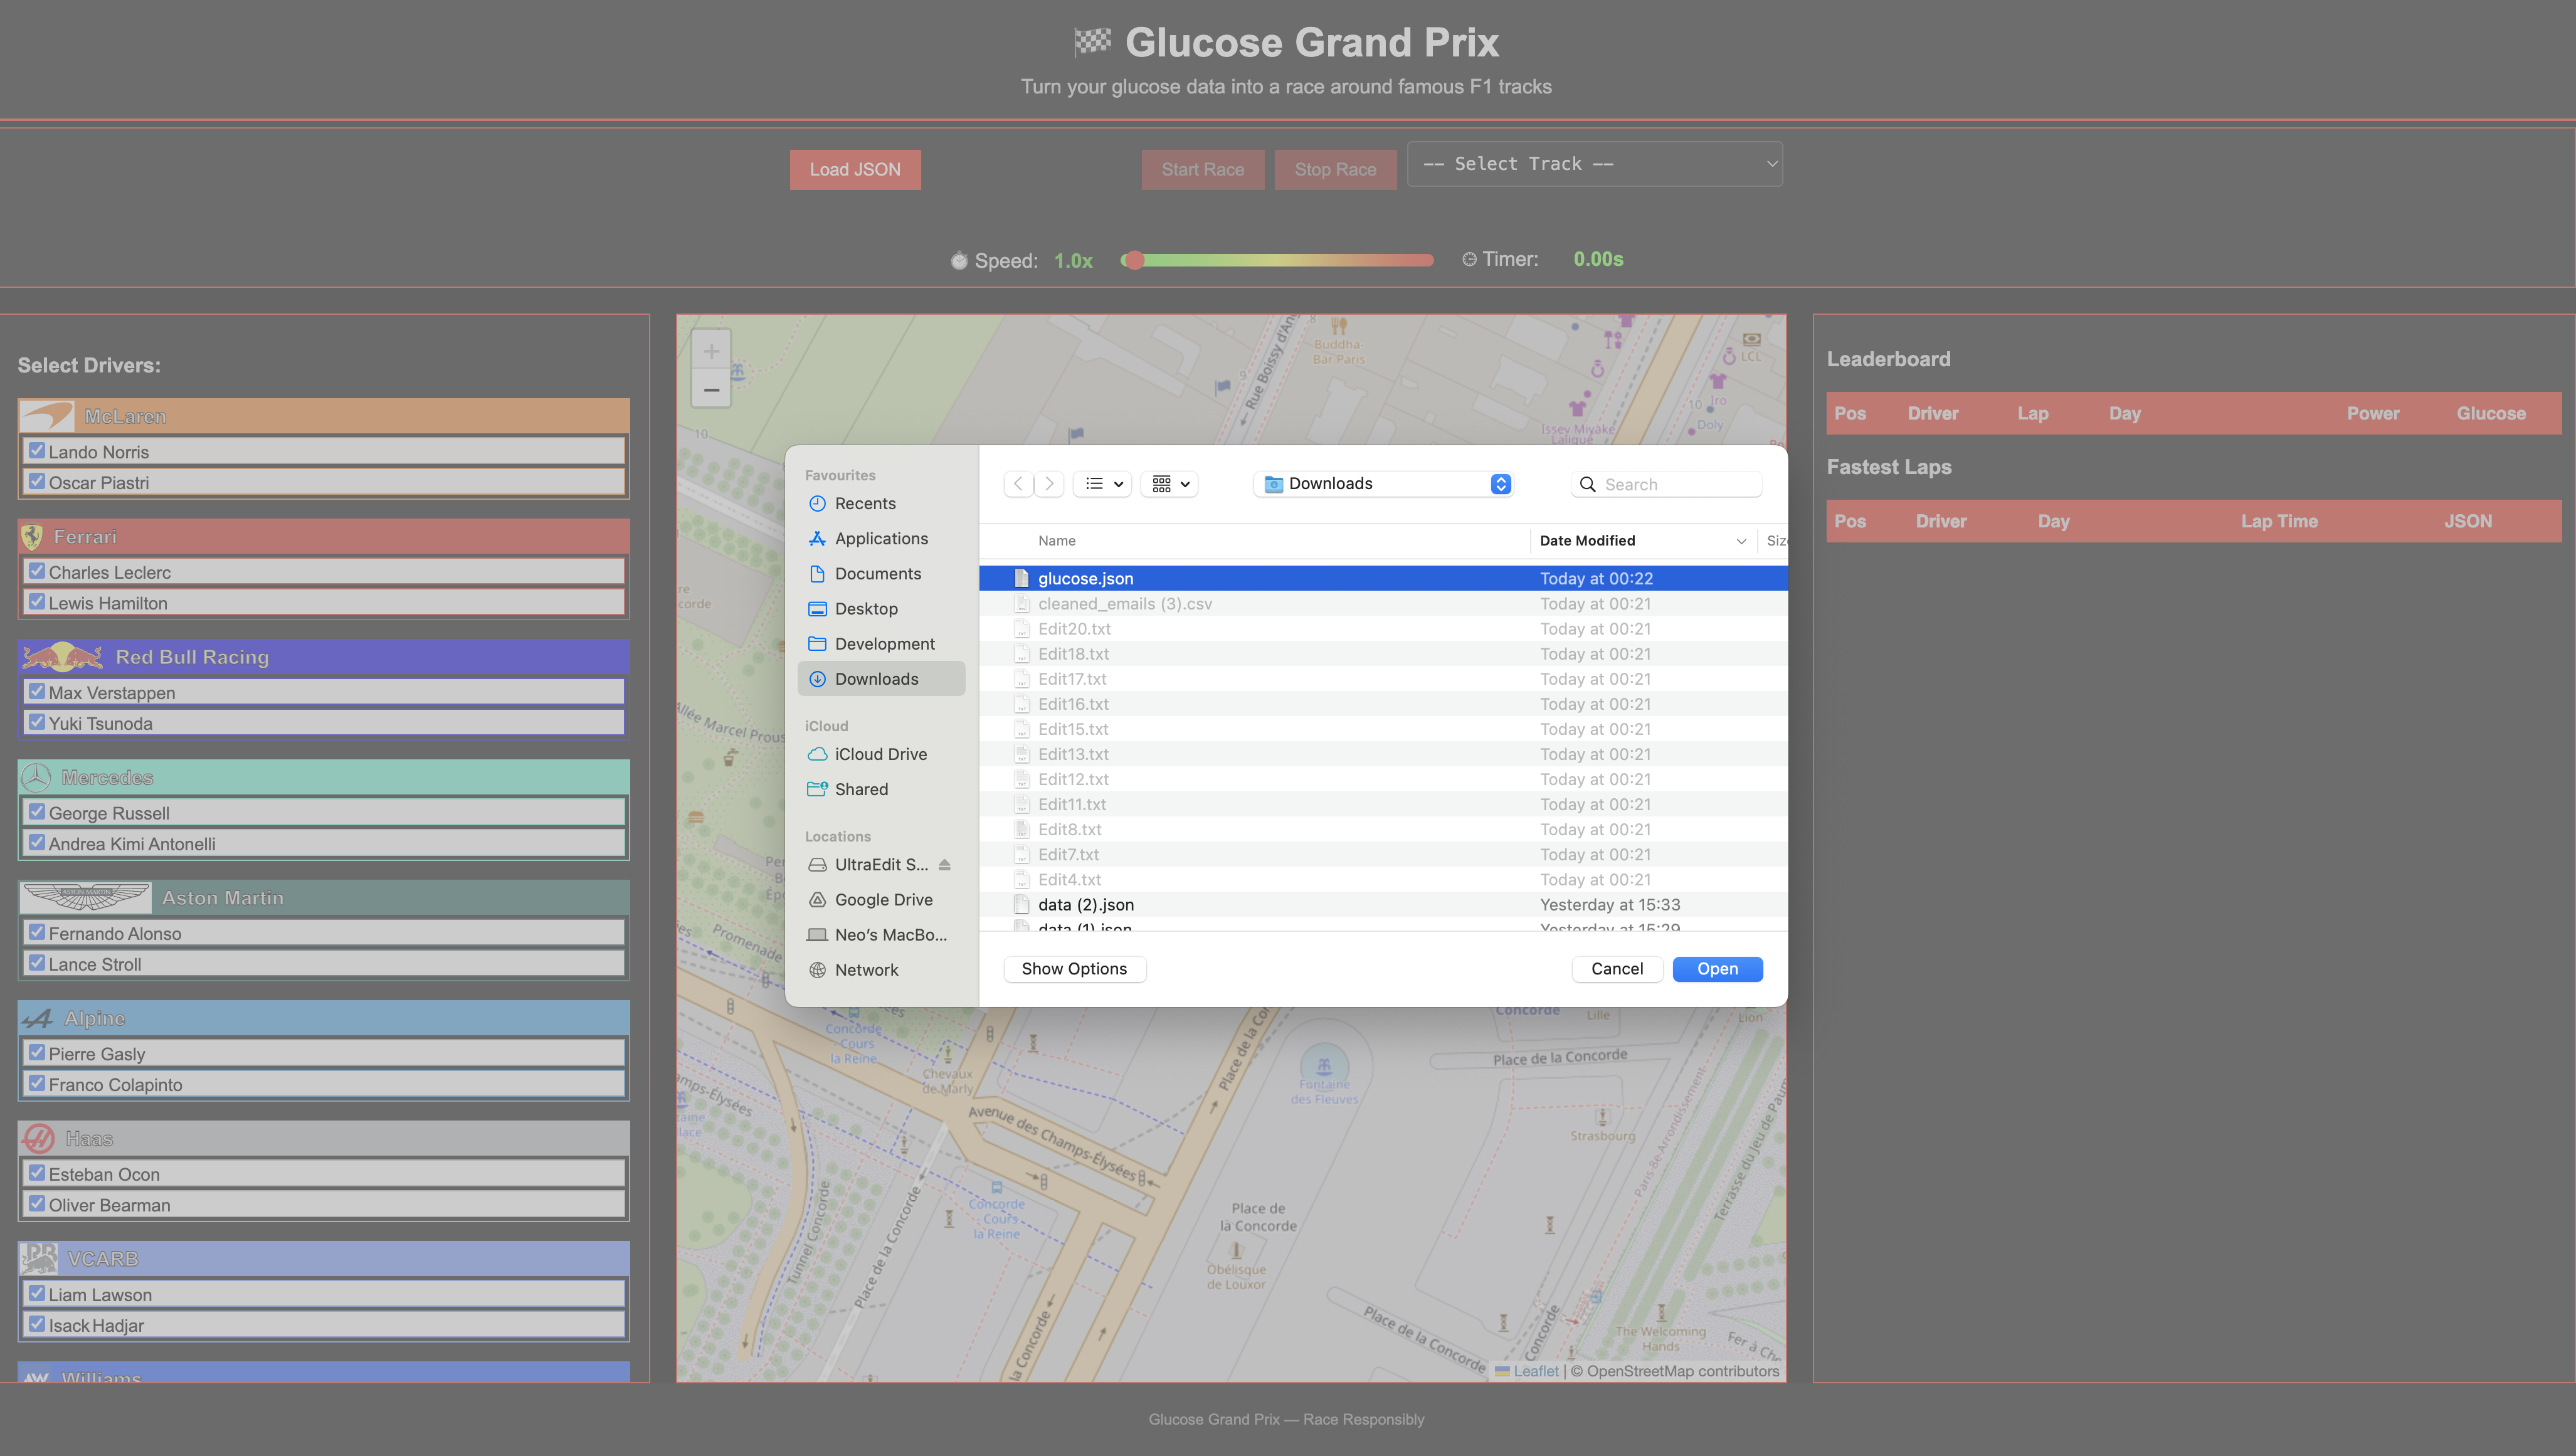
-
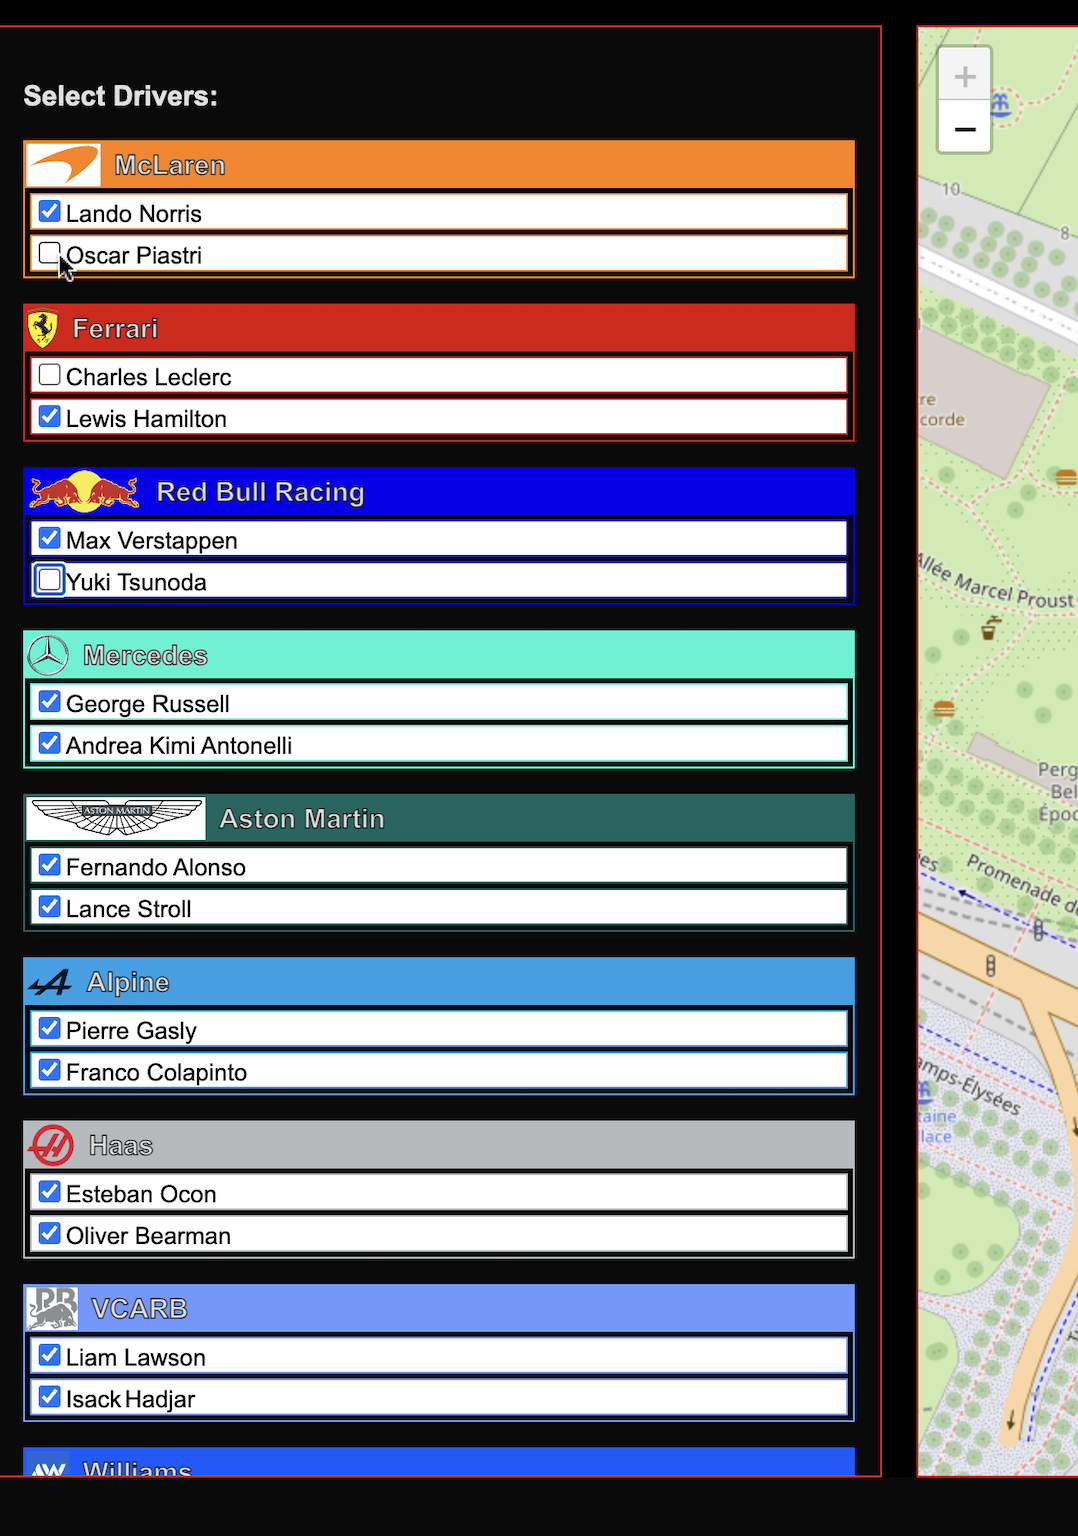
Select your drivers Select the drivers you wish to include in this race using the checkbox selection panel.
-
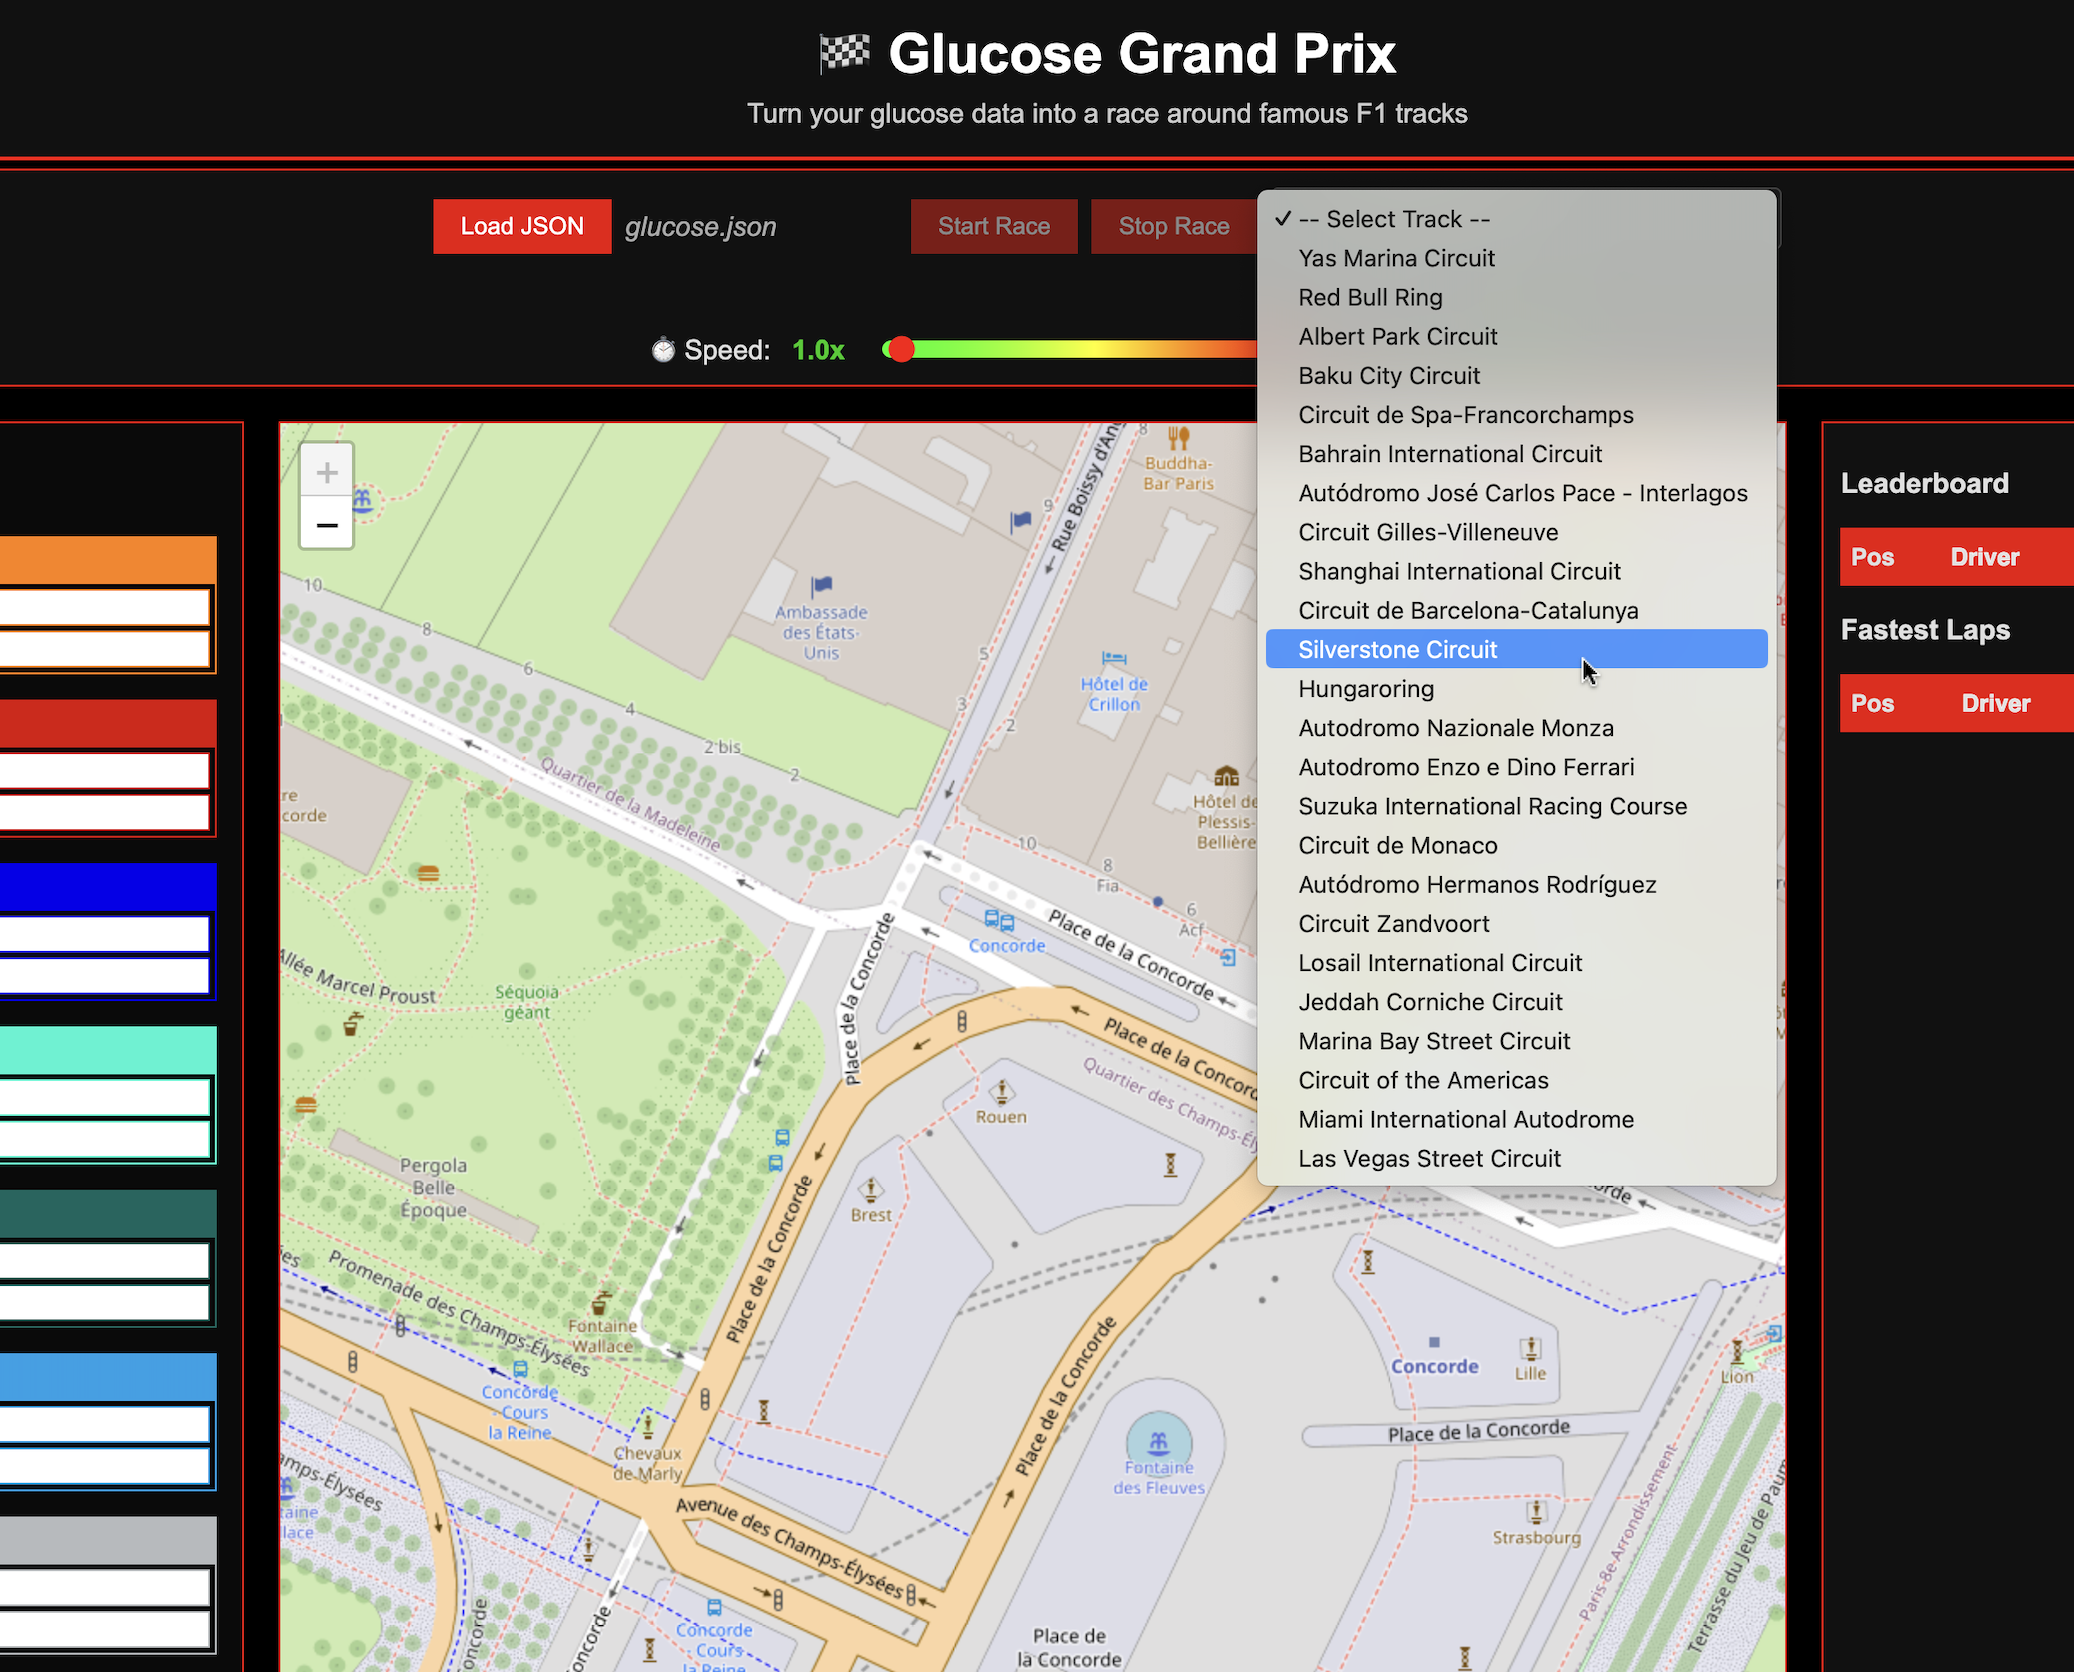
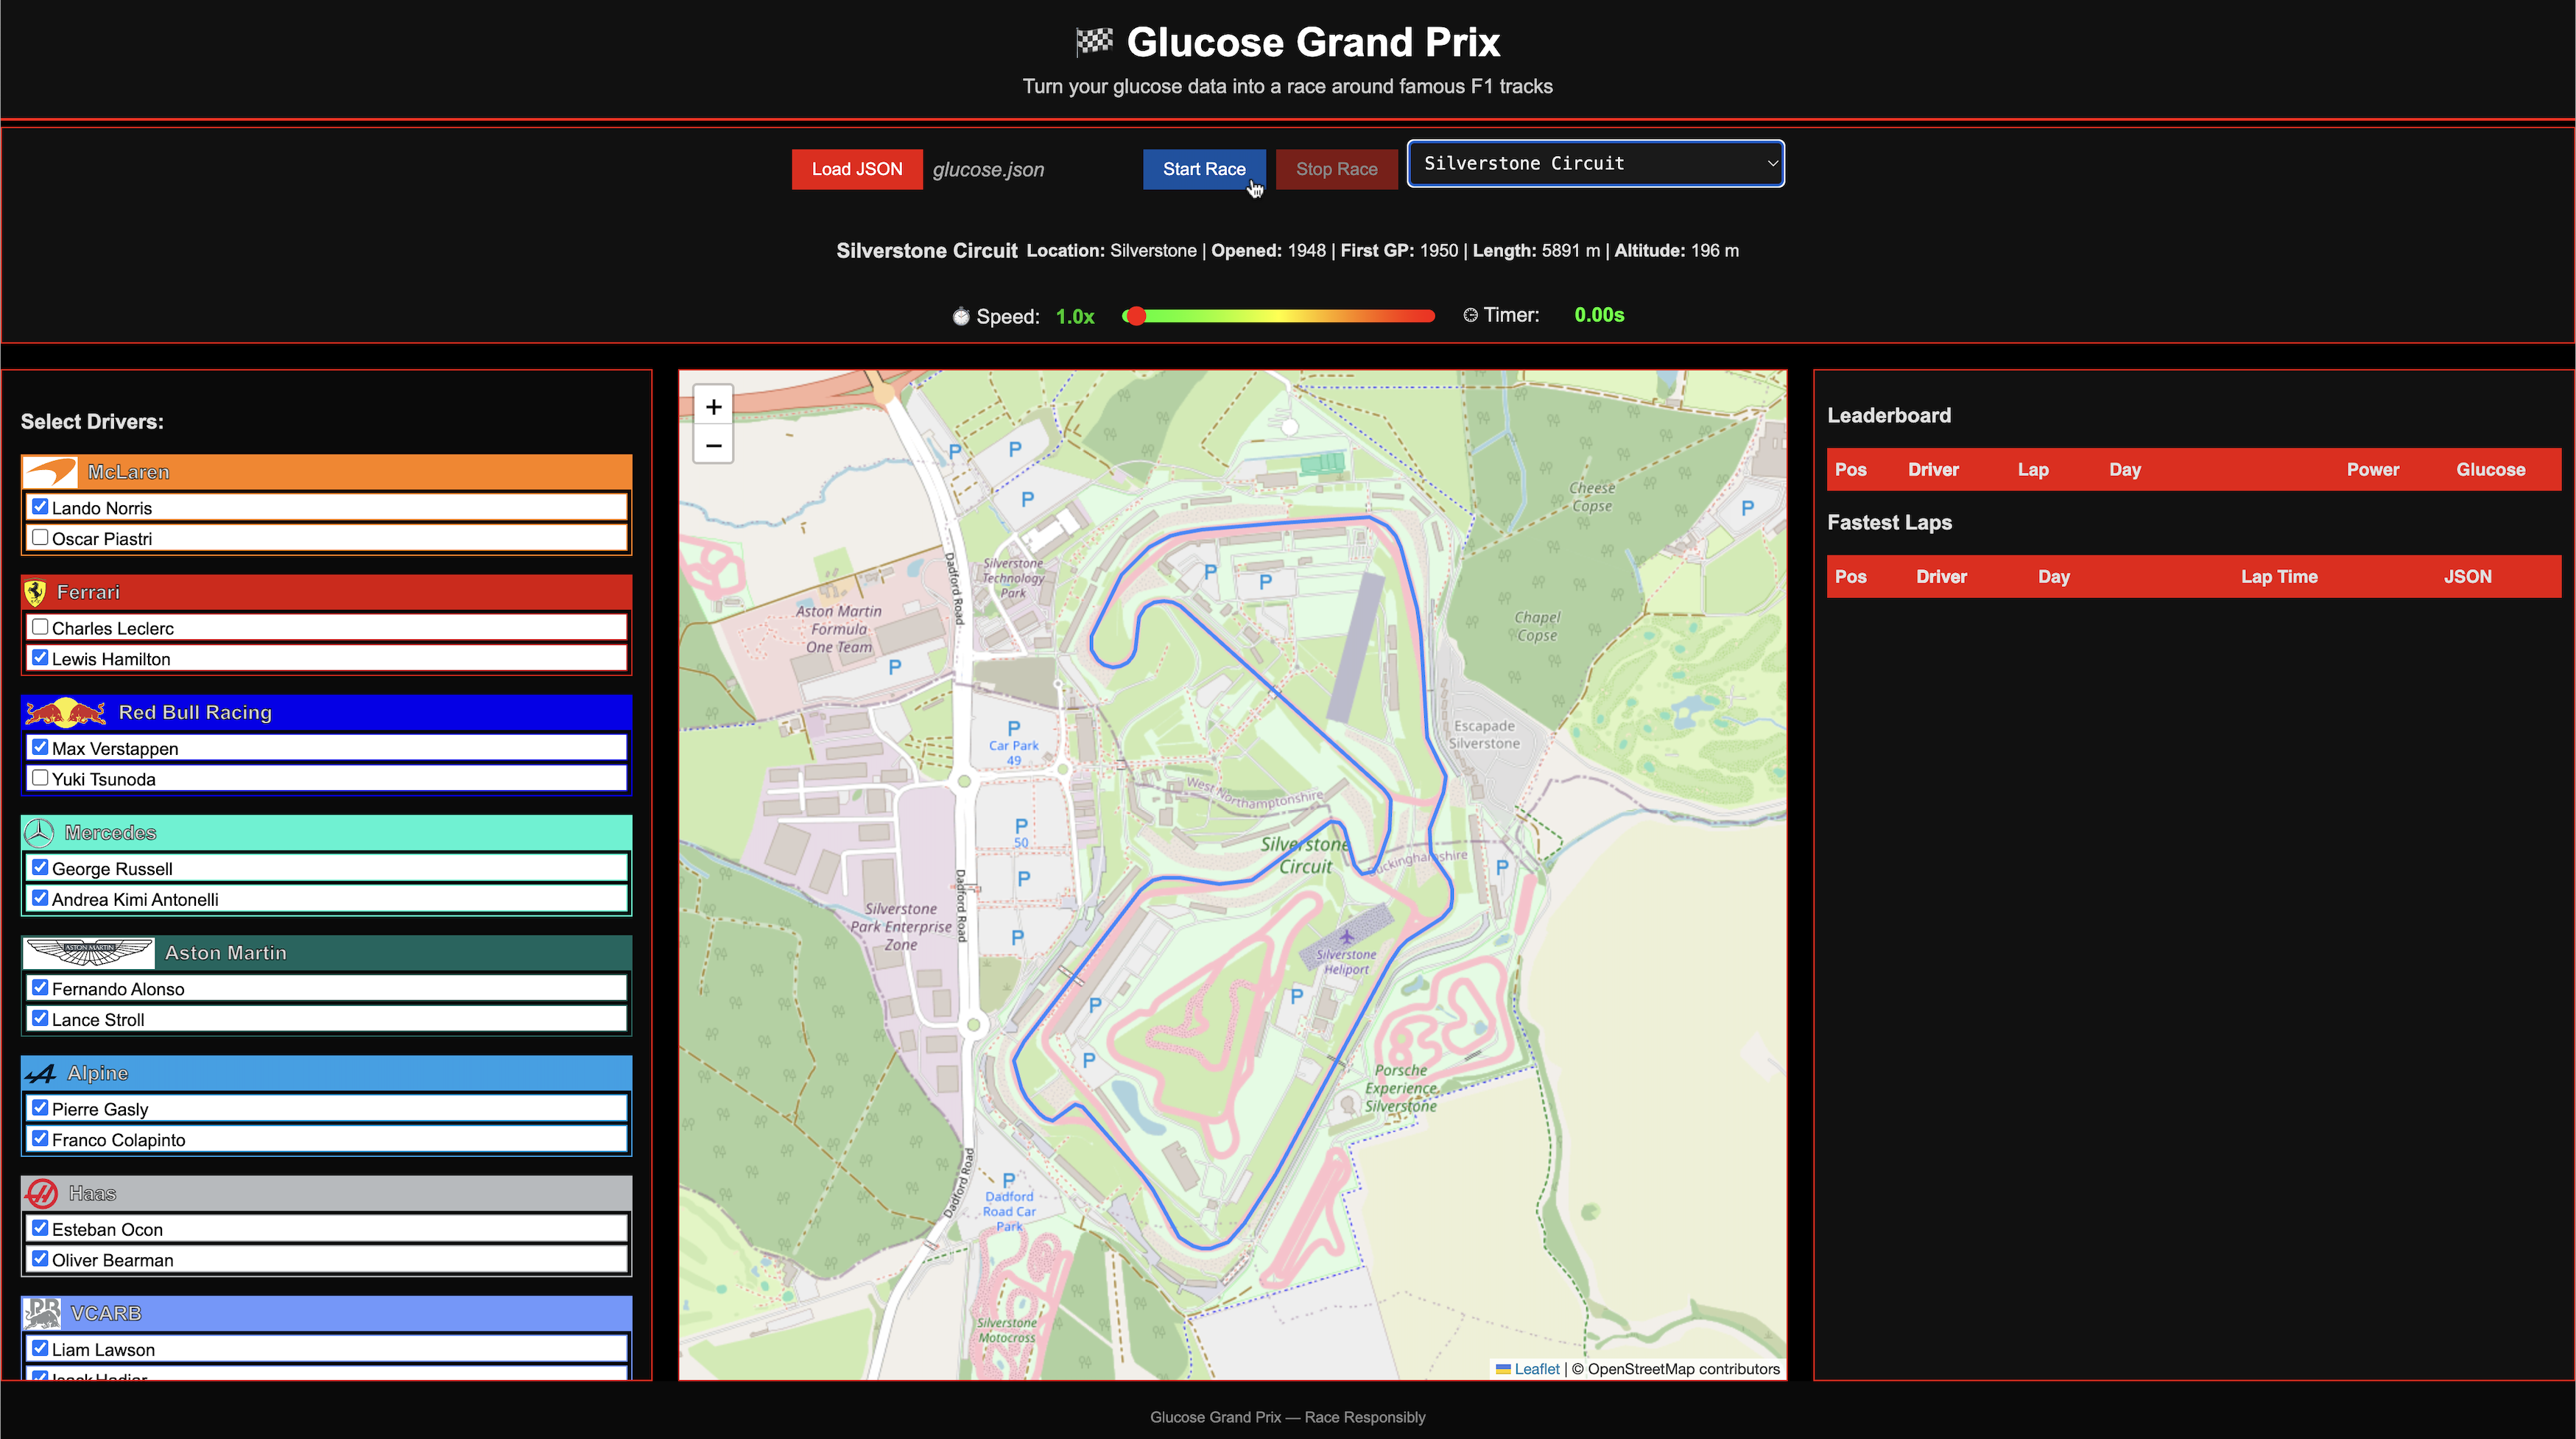
Select the track Select the track you wish to race on. Click on the dropdown, make your selection and you’ll see the track appear in the map.
-
Start the race Click on the Start Race button.
-
Speed up or slow down the race pace Use the Speed Slider to increase or decrease the time. These races have been set up to similate the fastest lap times as closely as possible for a small web app, so you may want to speed things up a bit.
-
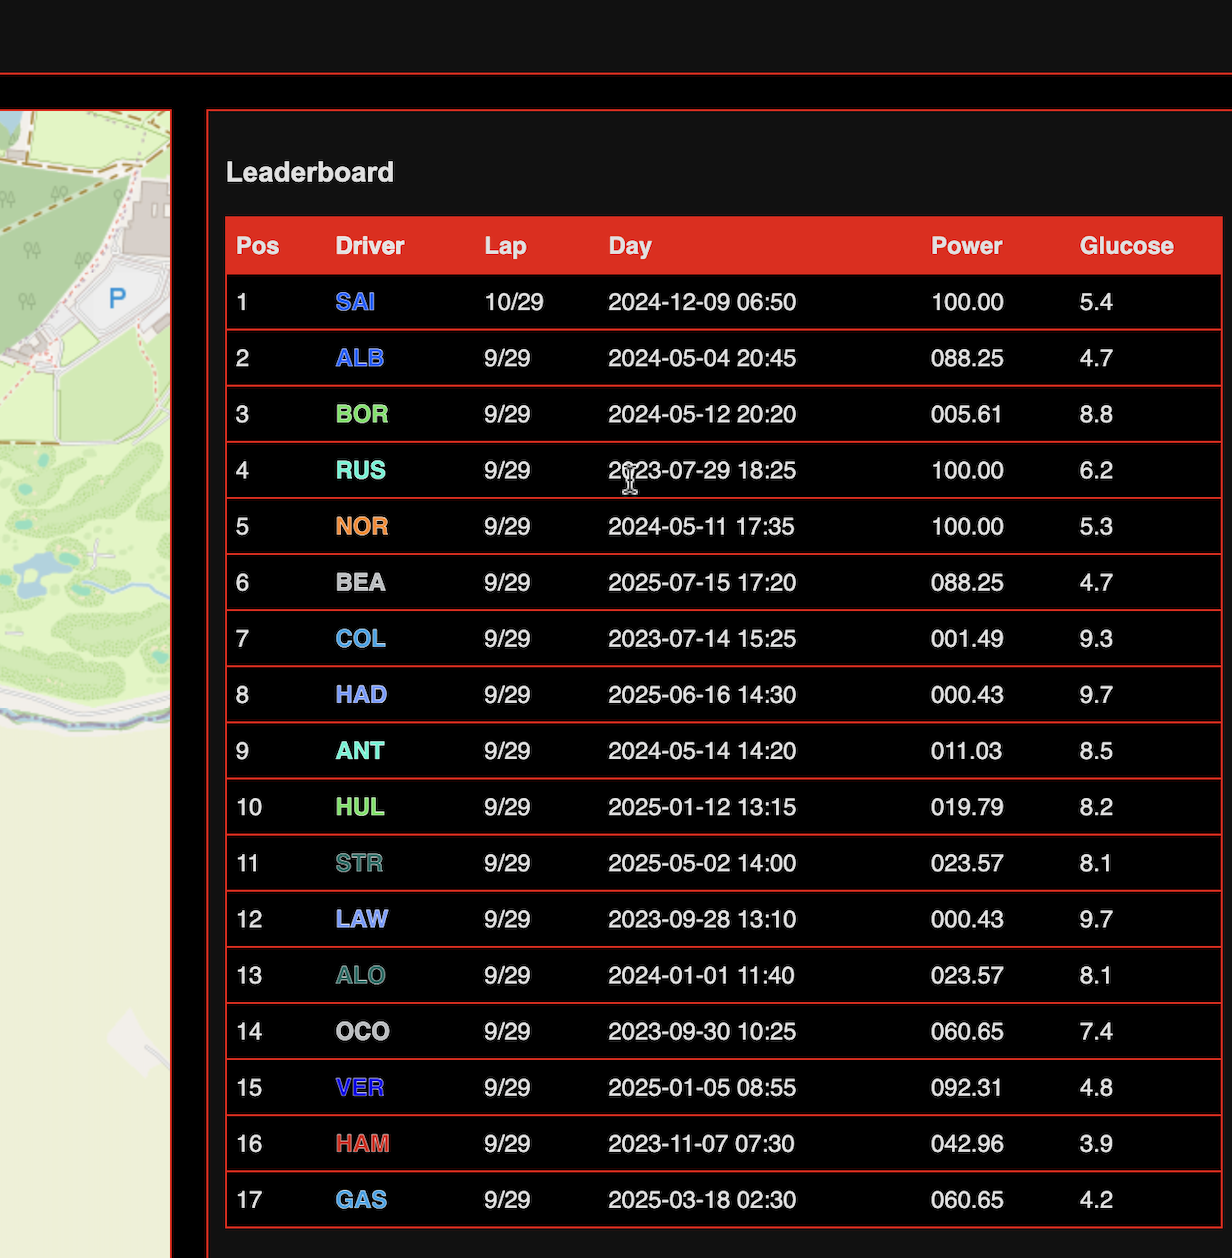
The leaderboard This shows the driver positions, the lap numbers, the ‘glucose day’ that the lap corresponds to, the computed ‘power’ for that moment and the actual ‘glucose’ reading that the power was calculated from.
-
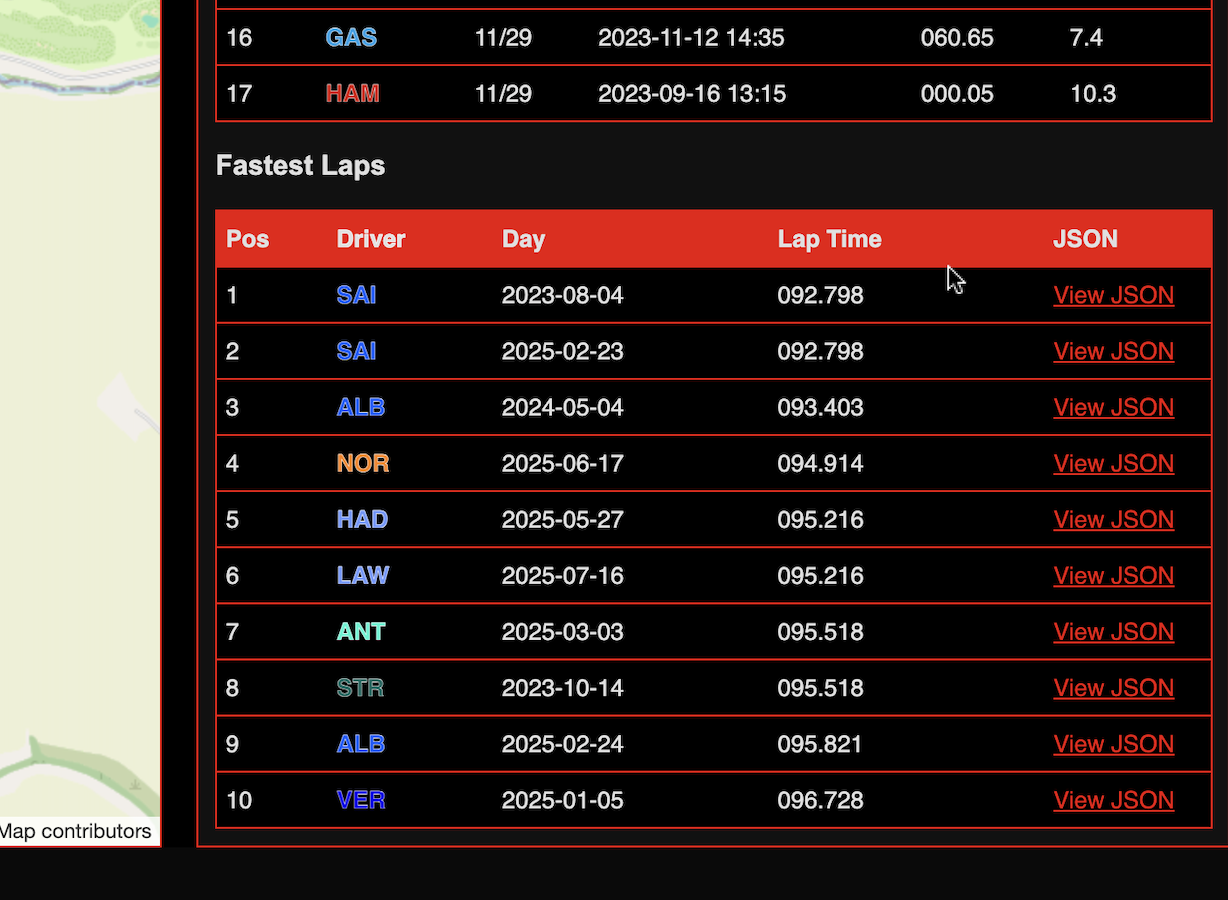
The fastest laps table This table shows the top 10 fastest laps for the race. It is constantly updated throughout the race.
-
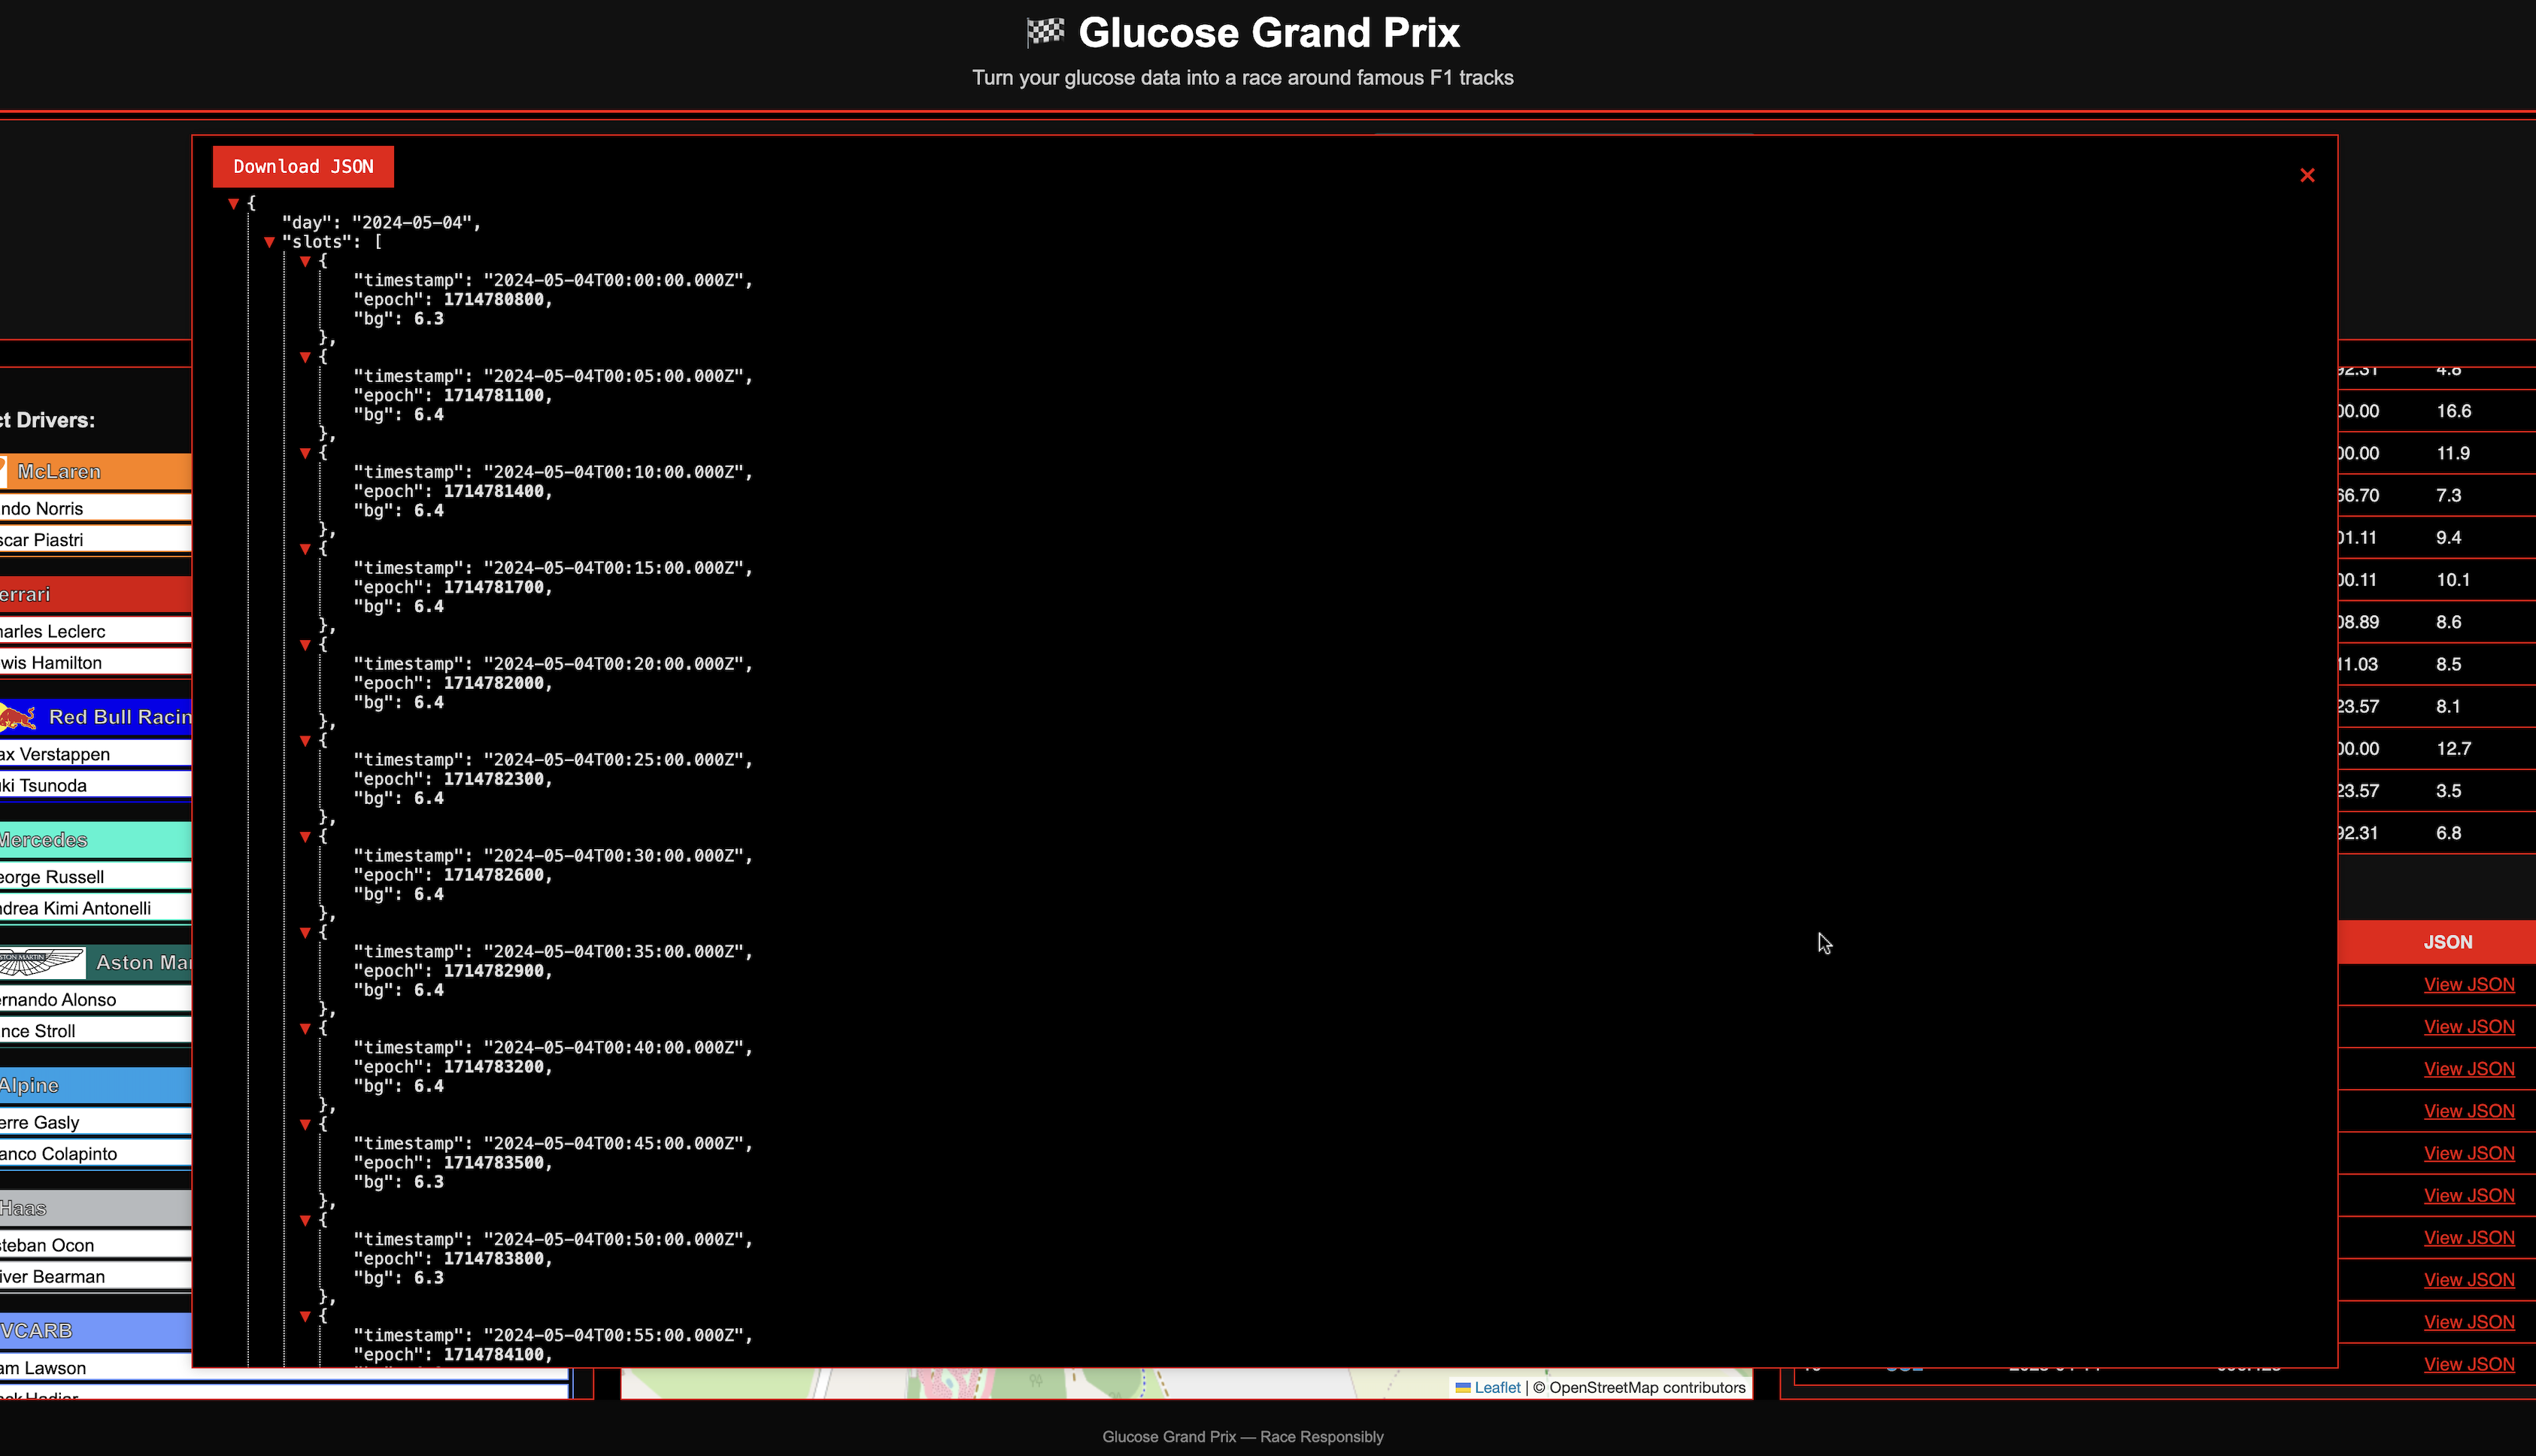
Fastest lap details
You can drill into the detail of any ‘fastest lap’ by clicking on the ‘View JSON’ link…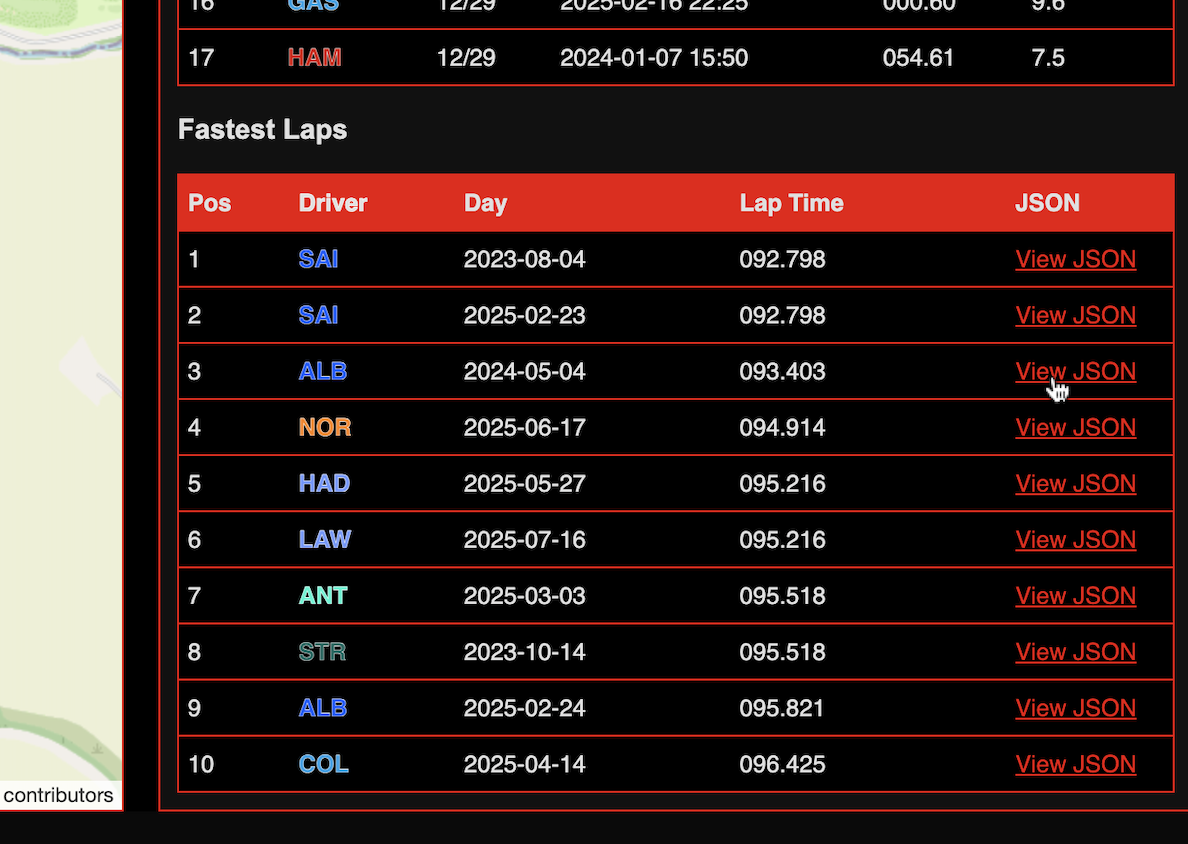 …and seeing this detail in JSON format appear in a popup. This data can be downloaded.
🎯 Customisation Ideas
- Add a multi-user “competitive” feature and compete with diabetic friends
- Change how performance is calculated (edit
getPerformance()) - Show month-over-month comparison laps
- Get Glooko to include features like this into their website
📝 License
This project is licensed under the MIT License. You can use, modify, and distribute it freely as long as attribution is preserved.
🧠 Final Thoughts
Glucose Grand Prix isn’t a replacement for traditional analysis. It’s a just a fun alternative way to look at your sugar data. This is just a proof of concept and could be enhanced to add many different features.
If you build on it, I’d love to see what you create. Feel free to fork, remix, or race your own way.